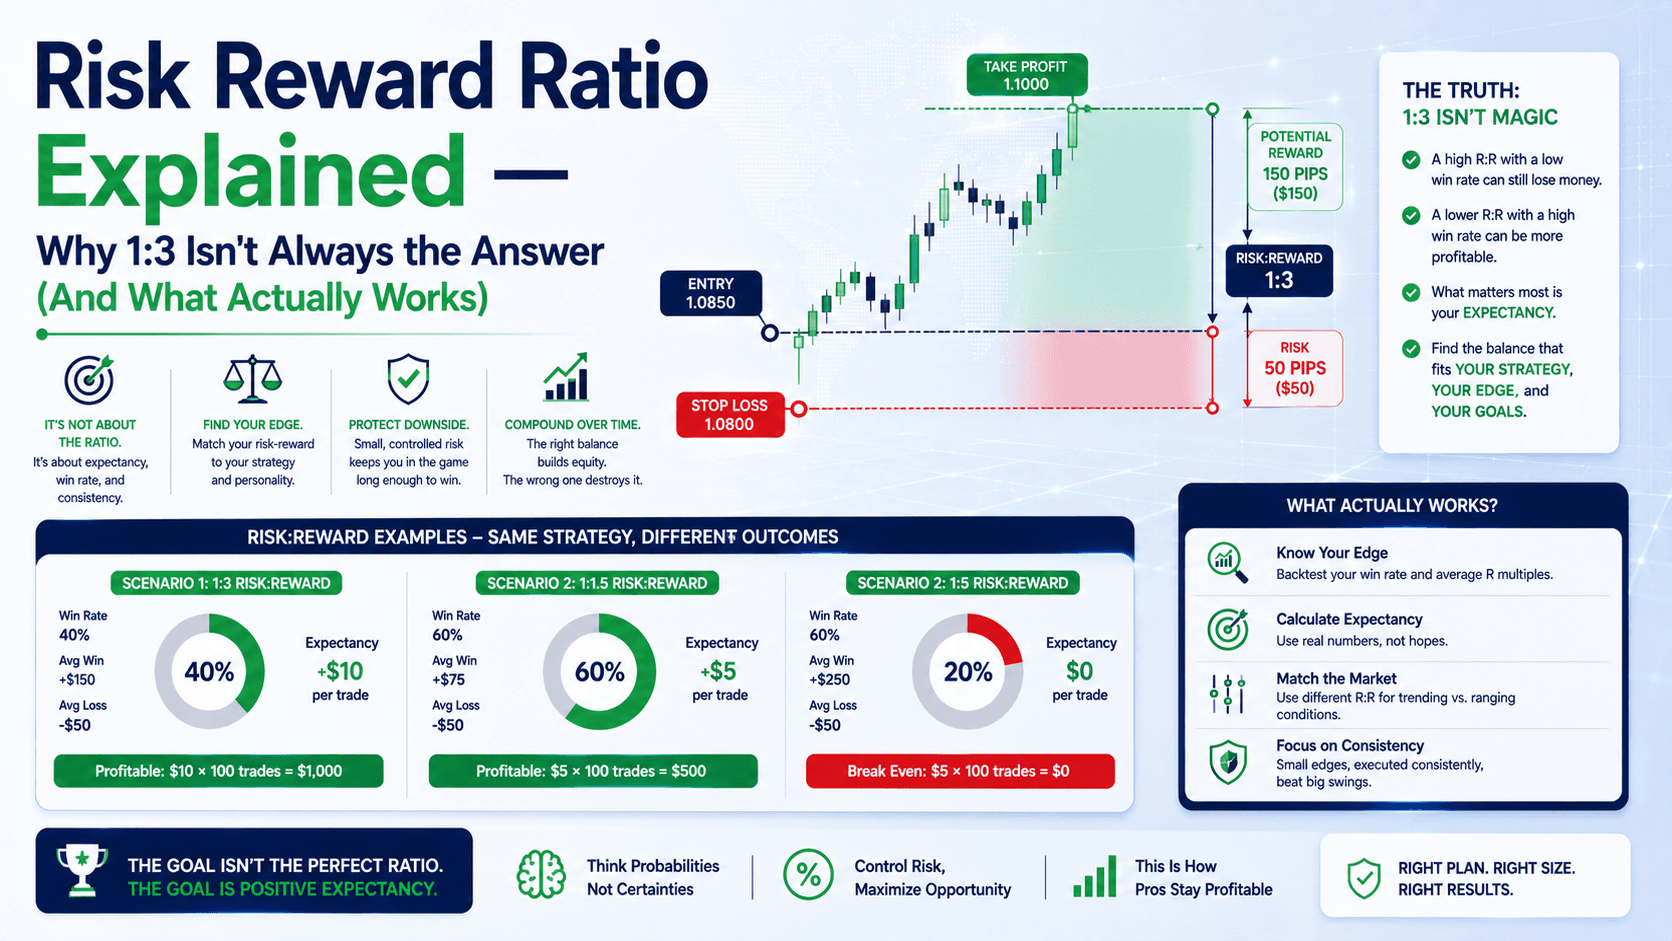
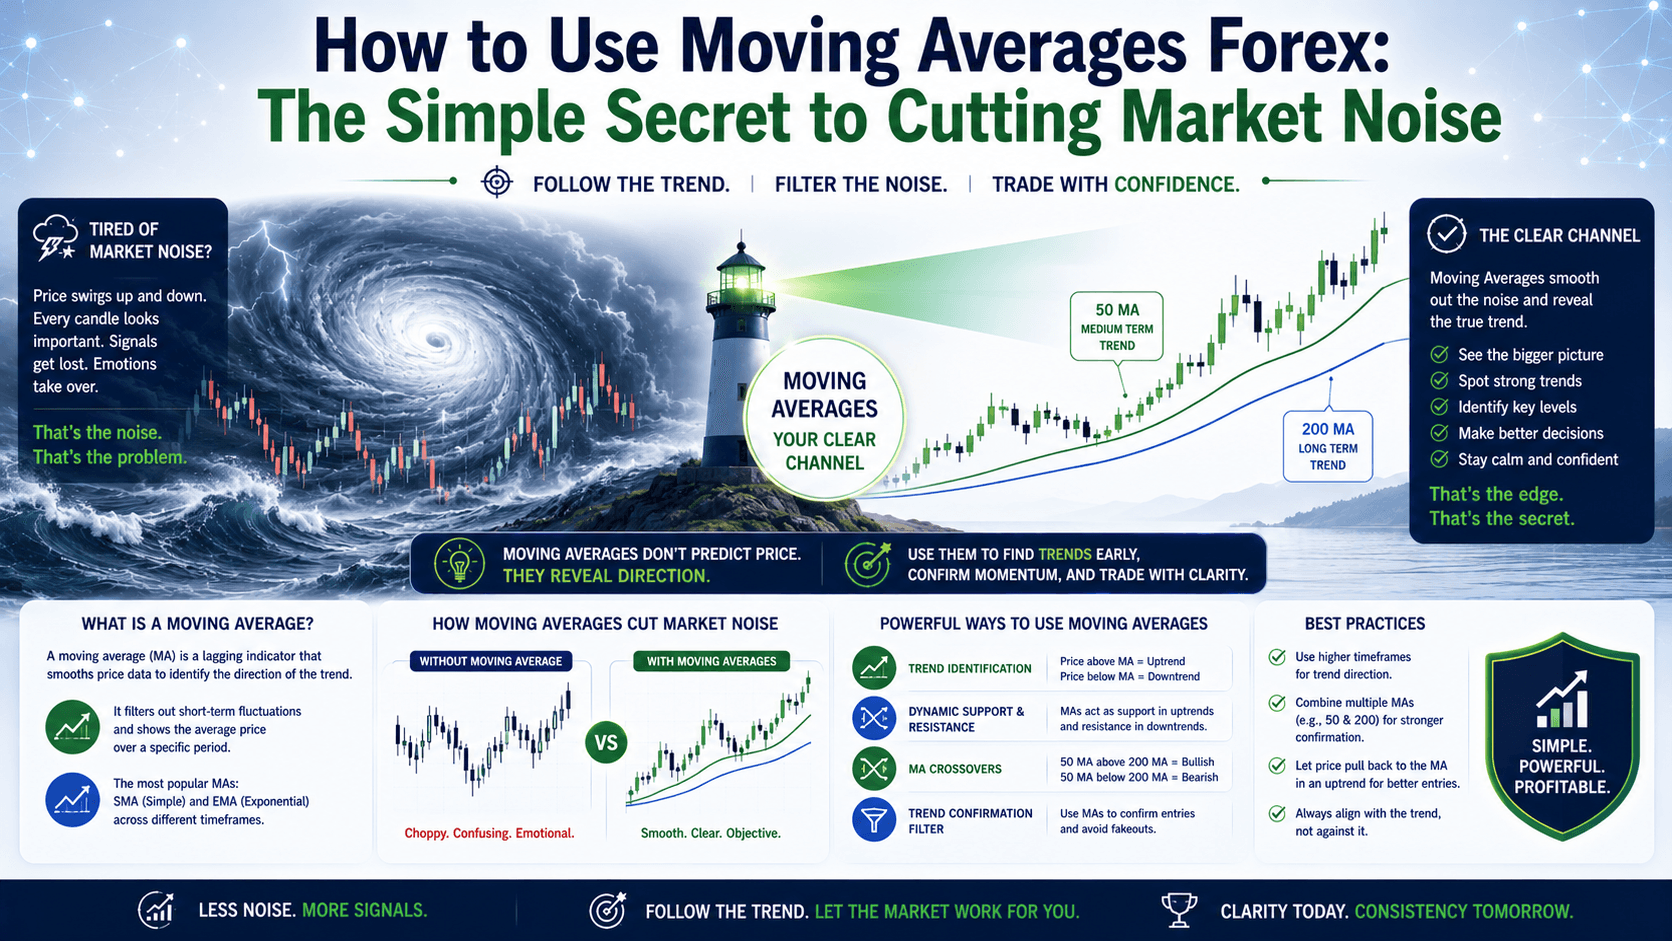
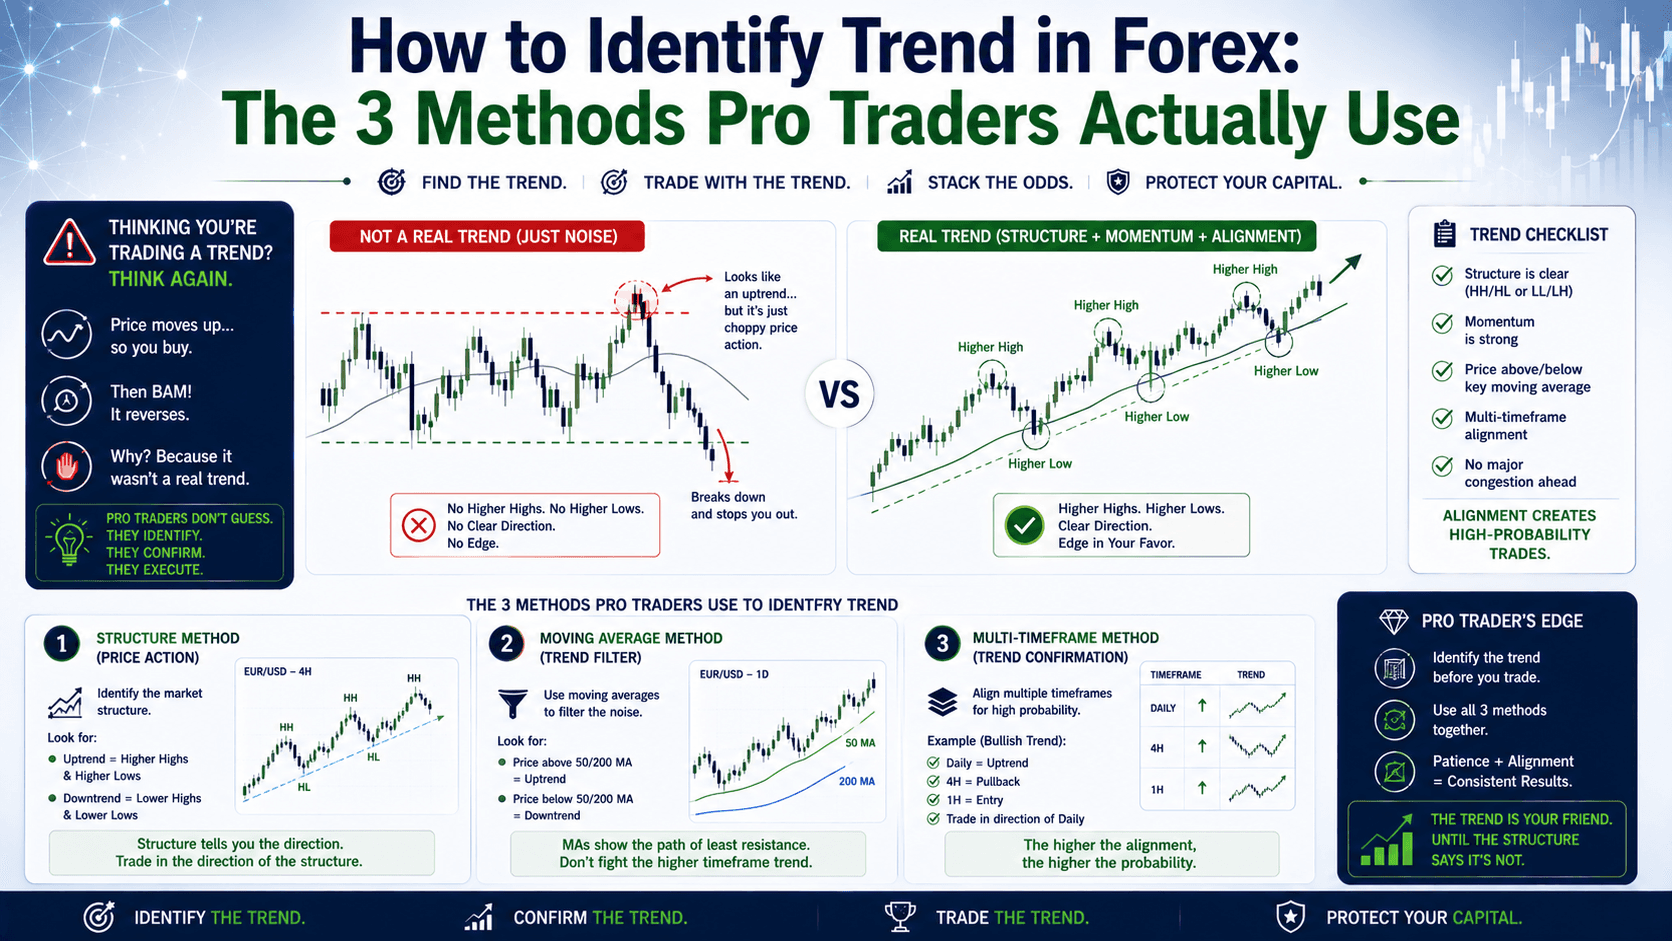
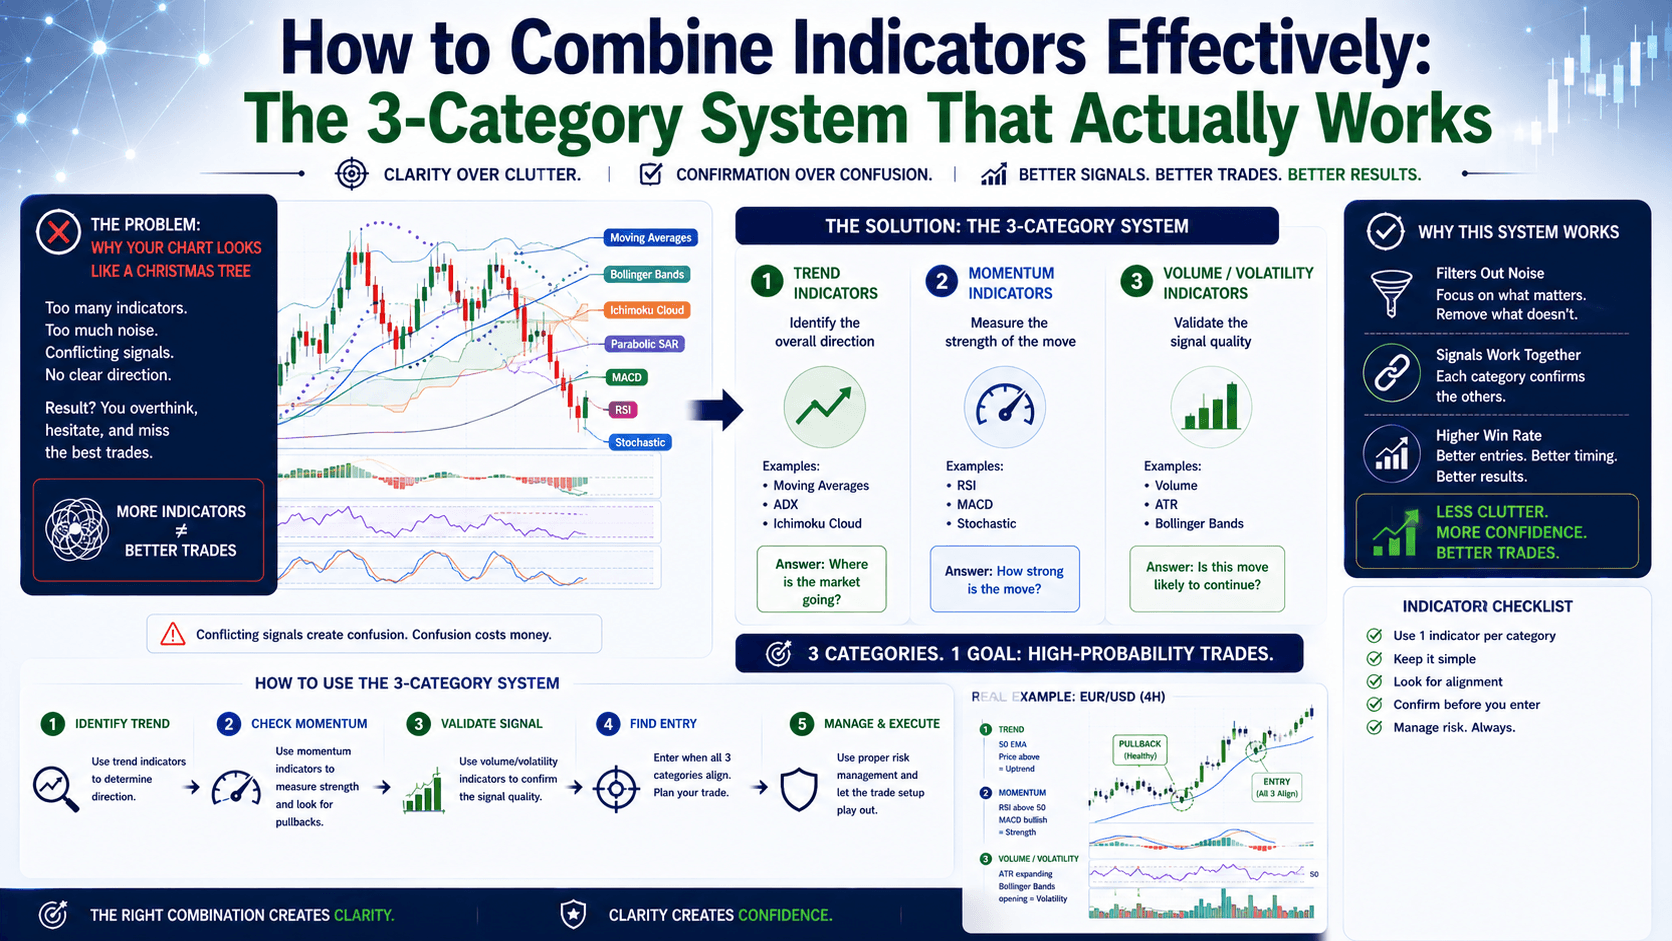
Deep dive into our premium collection of trading strategies, market analysis, and psychological insights.

Why Most Traders Get Multi-Timeframe Analysis Wrong You've probably been there. You see a perfect setup on the 5-minute chart. EUR/USD breaks a resistance...

The MACD Indicator: Is It Your Holy Grail, Or Just Another Pretty Line? Ever tried an indicator that looked awesome in backtesting, only to get chopped up by...

Here's the Problem Most Traders Face You've got your chart open. EUR/USD at 1.0875. You see the RSI dipping below 30 — "oversold," time to buy. You go long...

Why Most Traders Get Overwhelmed by the Ichimoku Cloud You've seen it on a chart. Five lines, a colored cloud, and it looks like someone spilled a box of...

Tired of Market Noise? Moving Averages Are Your Clear Channel Ever stare at your forex chart and feel like you're trying to find a signal in a hurricane? Price...

Thinking You're Trading a Trend? Think Again. Ever been in a trade that felt "right" – you saw price moving up, so you bought. Then, BAM! It reverses, stops...

Ever Drawn a "Perfect" Trendline Only to See Price Ignore It? You’re not alone. Most beginners make the same mistake. They connect two random points, draw a...

The Problem: Why Your Chart Looks Like a Christmas Tree You've got 5 indicators on your chart. MACD, RSI, Stochastic, Bollinger Bands, and 3 different moving...

You Drew the Lines. Now What? You've probably seen it. A chart with those horizontal lines — 0.0%, 23.6%, 38.2%, 50.0%, 61.8%, 100%. The Fibonacci retracement...
Trading forex, cryptocurrencies, and CFDs carries a high level of risk and may not be suitable for all investors. You may lose more than your initial investment. Only trade with money you can afford to lose. Past performance is not indicative of future results. Please ensure you fully understand the risks involved and seek independent advice if necessary.
© 2026 The Next Trade. All rights reserved.