
The Problem: Why Your Chart Looks Like a Christmas Tree
You've got 5 indicators on your chart. MACD, RSI, Stochastic, Bollinger Bands, and 3 different moving averages. They're all flashing different signals. One says buy, another says sell, and the third one is just flatlining.
Sound familiar? That's the chaos of indicator redundancy — using multiple tools that measure the same thing. The data suggests most traders fall into this trap early on. And it costs them.
Let's compare what's actually happening under the hood.
| Indicator | Category | What It Actually Measures |
|---|---|---|
| RSI | Momentum | Speed of price change |
| Stochastic | Momentum | Speed of price change |
| MACD | Momentum | Speed of price change |
| Bollinger Bands | Volatility | Price deviation from average |
| ADX | Trend | Trend strength |
| Moving Average | Trend | Direction of price |
See the problem? RSI, Stochastic, and MACD all belong to the momentum category. They're telling you the same story, just in different fonts. The data suggests this overemphasizes one piece of information while completely ignoring others.
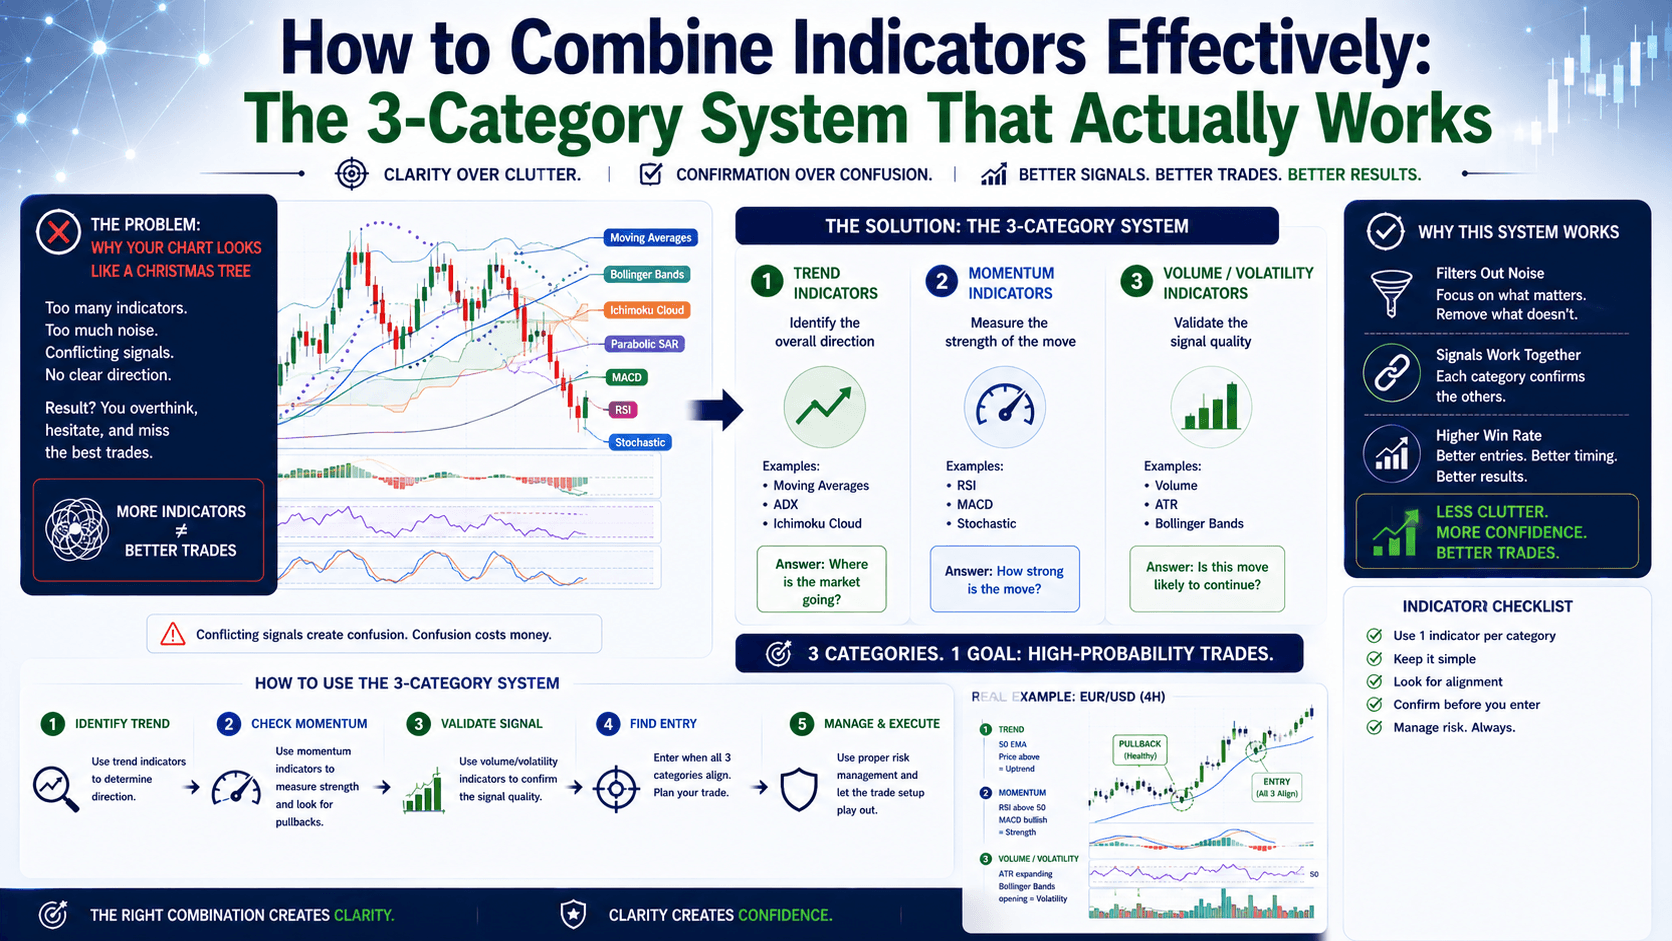
The 3-Category Framework: How to Combine Indicators Effectively
Here's the framework that professional traders use. Instead of stacking indicators from the same category, you pick ONE from each of the three main groups:
Category 1: Trend Indicators
These tell you direction. Is price moving up, down, or sideways? Examples: Moving Averages, ADX, Ichimoku Cloud.
On the other hand, trend indicators lag. They confirm what already happened. That's fine — you're not trying to predict the future, you're aligning with the current reality.
Category 2: Momentum Indicators
These measure speed and strength of price movement. Examples: RSI, Stochastic, CCI.
Momentum indicators help you spot when a move is losing steam. An RSI above 70 doesn't mean "sell now" — it means the buying pressure is extreme. The data suggests combining this with a trend indicator filters out most false signals.
Category 3: Volatility Indicators
These measure how much price moves. Examples: Bollinger Bands, ATR, Keltner Channels.
Volatility indicators tell you when to expect big moves (wide bands) or tight ranges (narrow bands). Unlike trend indicators, they don't tell you direction — they tell you the environment.
The Right Way: A Real Trade Example
Let's say EUR/USD is at 1.0850. You see a potential long setup. Here's how to combine indicators effectively using the 3-category system:

Step 1: Check the Trend
You look at the 50-period moving average on the 1-hour chart. Price is above it. The slope is upward. The data suggests a bullish trend. Signal: Bullish bias confirmed.
Step 2: Check Momentum
You look at the RSI (14-period). It's at 55 — above 50 but not overbought. No divergence. Signal: Momentum supports the trend.
Step 3: Check Volatility
You look at Bollinger Bands. The bands are narrow (squeeze), and price just bounced off the middle band. Signal: Low volatility environment, potential breakout.
Trade Decision: Go long at 1.0855. Stop loss at 1.0830 (25 pips below recent support). Target at 1.0890 (35 pips). Risk: $25 on 0.1 lots. Reward: $35. Risk:Reward = 1:1.4.
Notice what happened here: Each indicator gave you a different piece of the puzzle. No redundancy. No conflicting signals. Just three independent data points pointing in the same direction.
The Wrong Way: Why 3 Momentum Indicators Fool You
Here's the trap most beginners fall into:
You add MACD, RSI, and Stochastic to your chart. All three are momentum indicators. When price rallies, they all rise together. When price drops, they all fall together. When price is flat, they all flatten.
The data suggests this gives you a false sense of confidence. You think "three indicators confirm the trend" — but they're all measuring the same thing. It's like asking three people the same question and being surprised they give the same answer.
On the other hand, a proper combination gives you:
- Trend indicator: "Price is going up."
- Momentum indicator: "The move is losing steam."
- Volatility indicator: "We're in a low-volatility environment, so expect a breakout."
Now you have a nuanced picture. You don't just buy blindly. You wait for the momentum to pick up again, or you look for a pullback to enter at a better price.
Practical Combinations That Work
Here are three tested combinations. Each picks one indicator from each category:
| Combination | Trend | Momentum | Volatility | Best For |
|---|---|---|---|---|
| Classic | 50 EMA | RSI (14) | Bollinger Bands (20,2) | Swing trading |
| Scalper | 20 EMA | Stochastic (5,3,3) | ATR (14) | Short-term entries |
| Trend Strength | ADX (14) | MACD (12,26,9) | Keltner Channel | Trend following |
When we account for trading style, the optimal approach depends on your timeframe. A scalper needs faster signals (shorter EMAs, faster Stochastic). A swing trader can afford slower confirmation (longer EMAs, standard RSI).
Common Mistakes to Avoid
Mistake 1: Using 2+ indicators from the same category
If you have RSI and Stochastic, you're seeing the same data twice. The data suggests this leads to overtrading and false confidence.
Mistake 2: Ignoring price action
Indicators are derived from price. They lag. Always check support/resistance, trendlines, and candlestick patterns first. Indicators confirm, they don't predict.
Mistake 3: Using default settings blindly
A 14-period RSI works well on daily charts. On a 1-minute chart, it's useless. Adjust periods based on your timeframe. For day trading, try RSI (7) or Stochastic (5,3,3).
FAQ
How many indicators should I use on one chart?
3 is the sweet spot — one from each category (trend, momentum, volatility). More than 5 creates noise and conflicting signals.

Can I combine two trend indicators?
Yes, if they serve different purposes. For example, a 50 EMA for direction and ADX for strength. But avoid using two moving averages of similar periods — they'll tell you the same thing.
Is it better to use indicators or price action?
Both. Price action gives you entry/exit levels. Indicators provide context. A trend indicator confirms direction, momentum shows conviction, volatility sets expectations. Together, they're stronger.
What's the best combination for beginners?
Start with the Classic combo: 50 EMA (trend), RSI 14 (momentum), Bollinger Bands 20,2 (volatility). It's simple, effective, and teaches you how to combine indicators effectively.
📝 Quick Recap
- Indicators belong to 3 categories: Trend, Momentum, Volatility
- Pick ONE from each category — never stack from the same group
- Each indicator gives a different piece of information
- Test combinations on a demo account before going live
- Price action always comes first — indicators confirm
⚡ Quick Win
Open your chart right now. Pick EUR/USD on the 1-hour timeframe. Remove all indicators. Then add just 3: a 50-period EMA, RSI (14), and Bollinger Bands (20,2). Look at the last 5 trades you would have taken. How many would have been different with this 3-category system? The data suggests you'll see a clear improvement.


