
Tired of Market Noise? Moving Averages Are Your Clear Channel
Ever stare at your forex chart and feel like you're trying to find a signal in a hurricane? Price zipping up and down, candles everywhere, and zero clarity? It's a common pain point for new traders. You're not alone. Most beginners get lost in the day-to-day chaos, missing the bigger picture.
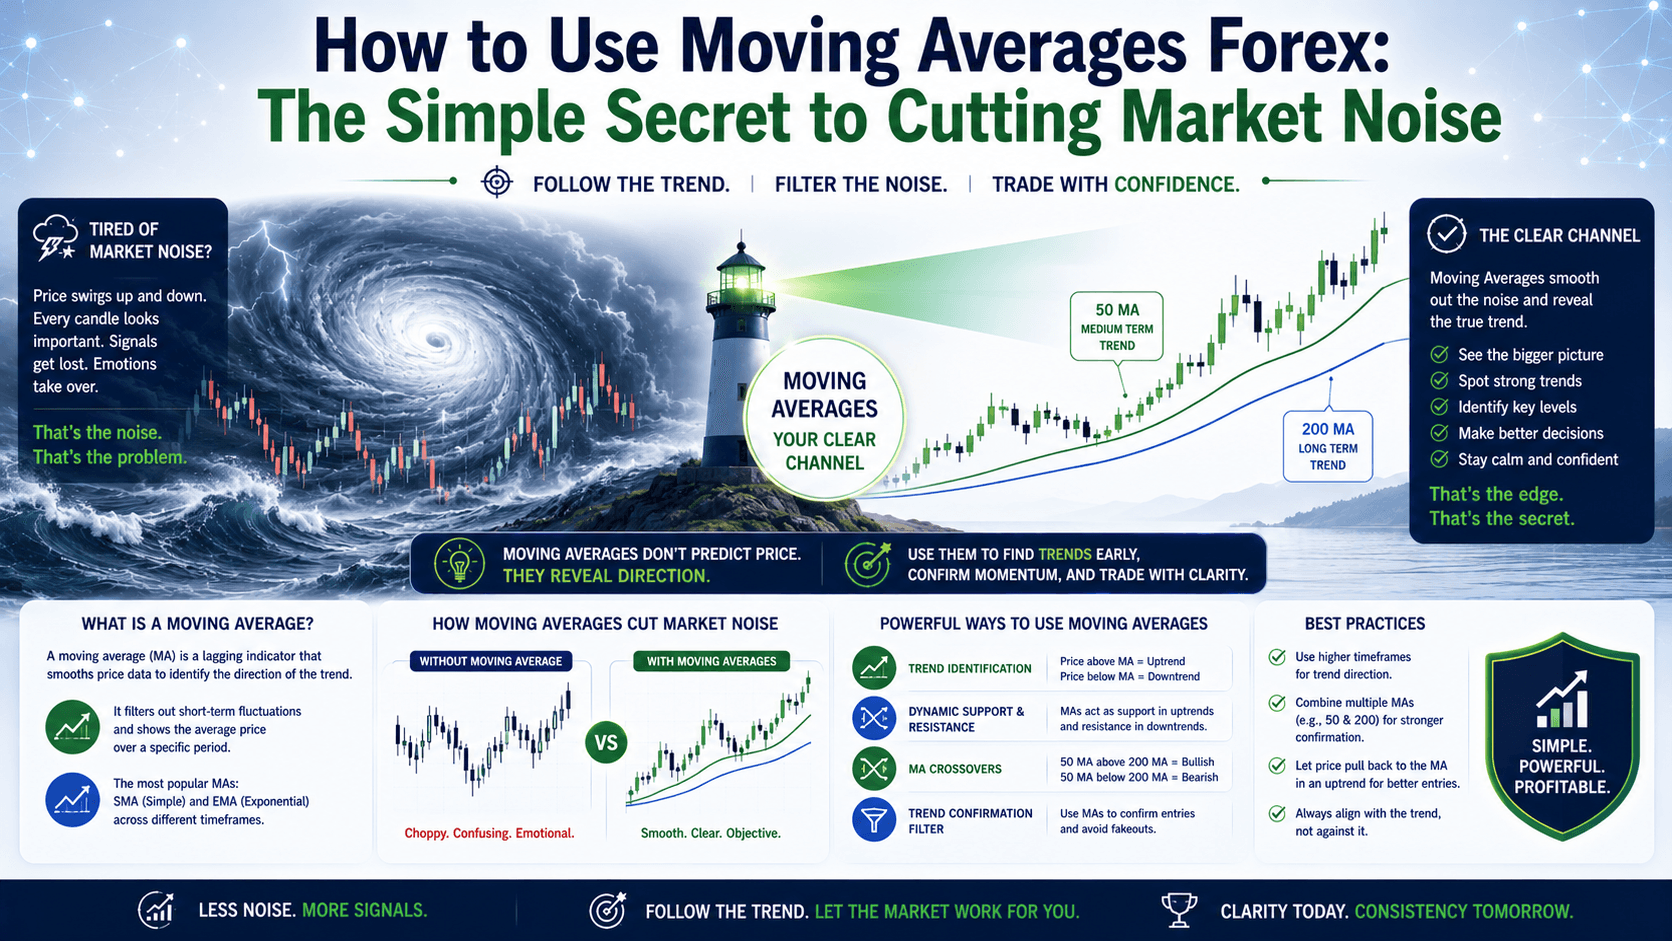
Here's the deal: The market wants to tell you something, but it's often whispering through a megaphone of random spikes and dips. That's where **moving averages (MAs)** come in. Think of them like noise-cancelling headphones for your chart. They smooth out all that choppy price action, revealing the true underlying trend.
In this lesson, you'll learn exactly how to use moving averages in forex trading to finally make sense of the market. We'll cut through the textbook jargon and show you, with real numbers, how these simple lines can transform your trading decisions.
What Are Moving Averages? Your Market GPS
At its core, a moving average is just an average price of a currency pair over a specific period. But the "moving" part is where the magic happens. As new price data comes in, the oldest data point drops off, and the average constantly updates. This creates a flowing line on your chart that strips away the daily distractions.
Why does this matter? Because markets have a tendency to "revert to the mean." Price might wander far from its average, but it often snaps back. MAs help you see that average, acting as a kind of gravitational pull for price.
Imagine EUR/USD is trading at 1.0850. If its 50-period moving average is at 1.0800 and price keeps bouncing off it, that MA is showing you something important about market sentiment.
SMA vs. EMA vs. WMA: Picking the Right Tool for the Job
Not all moving averages are created equal. They each have a different "personality" based on how they're calculated. Understanding these differences is key to choosing the right one for your trading style.

1. Simple Moving Average (SMA) – The Steady Tortoise
The **Simple Moving Average (SMA)** is the most basic. It takes all closing prices over a chosen period and gives each one equal weight. So, if you're looking at a 20-period SMA, the price from 20 periods ago is just as important as the most recent price.
This equal weighting makes SMA very smooth and reliable. It's slower to react to new price changes, which means fewer false signals. It's great for identifying long-term trends and less volatile swings.
2. Exponential Moving Average (EMA) – The Agile Hare
The **Exponential Moving Average (EMA)** gives more weight to recent prices. It believes that what happened yesterday is more relevant than what happened 20 days ago. This makes EMA much more responsive to current price action.
If you're a day trader or scalper, EMA might be your go-to because it picks up trend changes faster. But be warned: this sensitivity can also lead to more false signals, especially in choppy markets.
3. Weighted Moving Average (WMA) – The Balanced Diplomat
The **Weighted Moving Average (WMA)** is a middle ground. It also gives more weight to recent prices, but the weighting can be more customized than EMA. This makes it more responsive than SMA but often smoother than EMA.
WMA isn't as commonly used by beginners, but it offers a balance for those who want responsiveness without the extreme sensitivity of an EMA.
Moving Average Comparison: Which One Wins?
Here's a quick breakdown to help you decide:
| Feature | SMA (Simple Moving Average) | EMA (Exponential Moving Average) | WMA (Weighted Moving Average) |
|---|---|---|---|
| Speed | Slowest to react | Fastest to react | Moderate reaction speed |
| Reliability | Most stable, fewer false signals | Can be jumpy in choppy markets | Balanced stability |
| Best For | Long-term trend identification, smoother charts | Quick trend changes, scalping, volatile markets | Swing trading, custom weighting |
| Calculation | All prices weighted equally | Recent prices heavily favored | Customizable weight distribution |
| Beginner Friendly | Very easy to understand | Requires more experience to interpret | Moderate complexity |
The optimal approach depends on your specific trading style and the market conditions. Start simple, then explore.
Beyond the Lines: How MAs Actually Guide Your Trades
Once you understand the types, it's time to put them to work. Moving averages aren't just pretty lines; they're powerful tools for finding entries, exits, and confirming trends.
1. Trend Identification with Crossovers
One of the most popular ways to use moving averages is with crossovers. This involves using two or more MAs of different lengths (e.g., a 10-period and a 50-period).
- Bullish Crossover: When a shorter-period MA crosses above a longer-period MA, it suggests an uptrend is starting or strengthening. Time to look for buys.
- Bearish Crossover: When a shorter-period MA crosses below a longer-period MA, it suggests a downtrend is starting or strengthening. Time to look for sells.
Let's say you're watching EUR/USD. The 10-period EMA crosses above the 50-period EMA at 1.0850. This is your signal to consider a long trade. You enter at 1.0855 with 0.1 lots. A 20-pip stop loss at 1.0835 means risking $20. If it moves to 1.0895 (40 pips), that's $40 profit.
2. Dynamic Support & Resistance
Moving averages don't just show trends; they often act as dynamic support and resistance levels. Price tends to bounce off them, especially in trending markets. Think of them as a "retest zone."
If EUR/USD is in an uptrend, price often pulls back to a major MA (like the 50-EMA or 200-SMA) before continuing higher. These pullbacks are fantastic low-risk entry points.
Scenario Breakdown: Catching the Bounce
It's Wednesday morning. Gold (XAU/USD) is in a strong uptrend on the 1-hour chart, with price consistently holding above the 50-EMA. Gold pulls back from $2350 to $2335, touching the 50-EMA.
You decide to go long:
- Entry: $2336.00 (right off the 50-EMA)
- Lot Size: 0.05 lots (standard lot is $10/pip, so 0.05 lots = $0.50/pip)
- Stop Loss: $2330.00 (60 pips below entry, risking $30)
- Target: $2348.00 (120 pips above entry, targeting $60)
This is a classic 1:2 risk-to-reward trade, using the moving average as your entry signal. Your math is simple: 60 pips * $0.50/pip = $30 risk. 120 pips * $0.50/pip = $60 reward.
⚠️ The Common Trap: The Lagging Indicator Lie
Every forex site will tell you, "Moving averages are lagging indicators." What they don't tell you is how this *actually costs you money*.
The Wrong Way: Most beginners wait for a perfect MA crossover for an entry. By the time the 10-EMA crosses the 50-EMA, the initial surge is often over. You're entering late, right as the early birds are taking profit, and you get stopped out on the first pullback.
The Right Way: Don't just trade the crossover. Use MAs to identify the trend, then wait for price to *pull back to the MA* during that trend. This gives you a much better risk-to-reward entry. The crossover tells you "what" the trend is; the pullback to the MA tells you "when" to enter.
It's about letting the MA define your trend and then finding smarter entries.
Setting Up Your MAs: The Right Periods for Your Style
You can adjust the "period" or "length" of your moving averages. This determines how many past candles are included in the calculation. Common settings include:
- Short-Term: 9, 10, 20 periods (for scalping, quick trend changes)
- Medium-Term: 50 periods (for swing trading, identifying main daily trends)
- Long-Term: 100, 200 periods (for identifying long-term market direction)
For most forex traders, a combination of a 10/20 EMA for entries and a 50/200 SMA for trend context works well. Always test different settings to see what works best for your chosen currency pair and timeframe.
FAQ
Are moving averages lagging indicators?
Yes, moving averages are by definition lagging indicators because they are based on past price data. They don't predict future prices but confirm existing trends, which means signals often appear after the move has already started.

Which moving average is best for day trading?
For day trading, the Exponential Moving Average (EMA) is often preferred over the Simple Moving Average (SMA) because it gives more weight to recent prices, making it more responsive to fast market changes and offering earlier signals.
How many moving averages should I use?
Most traders use 2-3 moving averages simultaneously (e.g., a short-term, a medium-term, and a long-term MA). This allows for trend identification, confirmation, and potential entry signals through crossovers or price interaction.
Can moving averages predict reversals?
Moving averages are better at confirming trends than predicting reversals. While a strong divergence or break of a long-term MA can suggest a reversal, relying solely on MAs for reversal predictions can lead to early entries and increased risk.
Quick Recap
- Moving averages smooth out price action to reveal the underlying trend.
- SMA, EMA, and WMA have different responsiveness due to their calculation methods.
- Use MAs for trend identification (crossovers) and dynamic support/resistance levels.
- Avoid the "lagging indicator trap" by waiting for pullbacks to MAs for entries, not just crossovers.
- Experiment with different MA periods (e.g., 10, 50, 200) to suit your trading style.
Your Quick Win: Find Your MA Sweet Spot Today
Open your trading platform right now. Pull up EUR/USD on the 1-hour timeframe. Add a 10-period EMA and a 50-period EMA to your chart. Scroll back in time and find 5 instances where the 10-EMA crossed the 50-EMA. Now, critically, look at what happened *after* the crossover. Did price immediately extend, or did it pull back before continuing? This exercise will show you the real market dynamics and help you understand the lagging nature of MAs.


