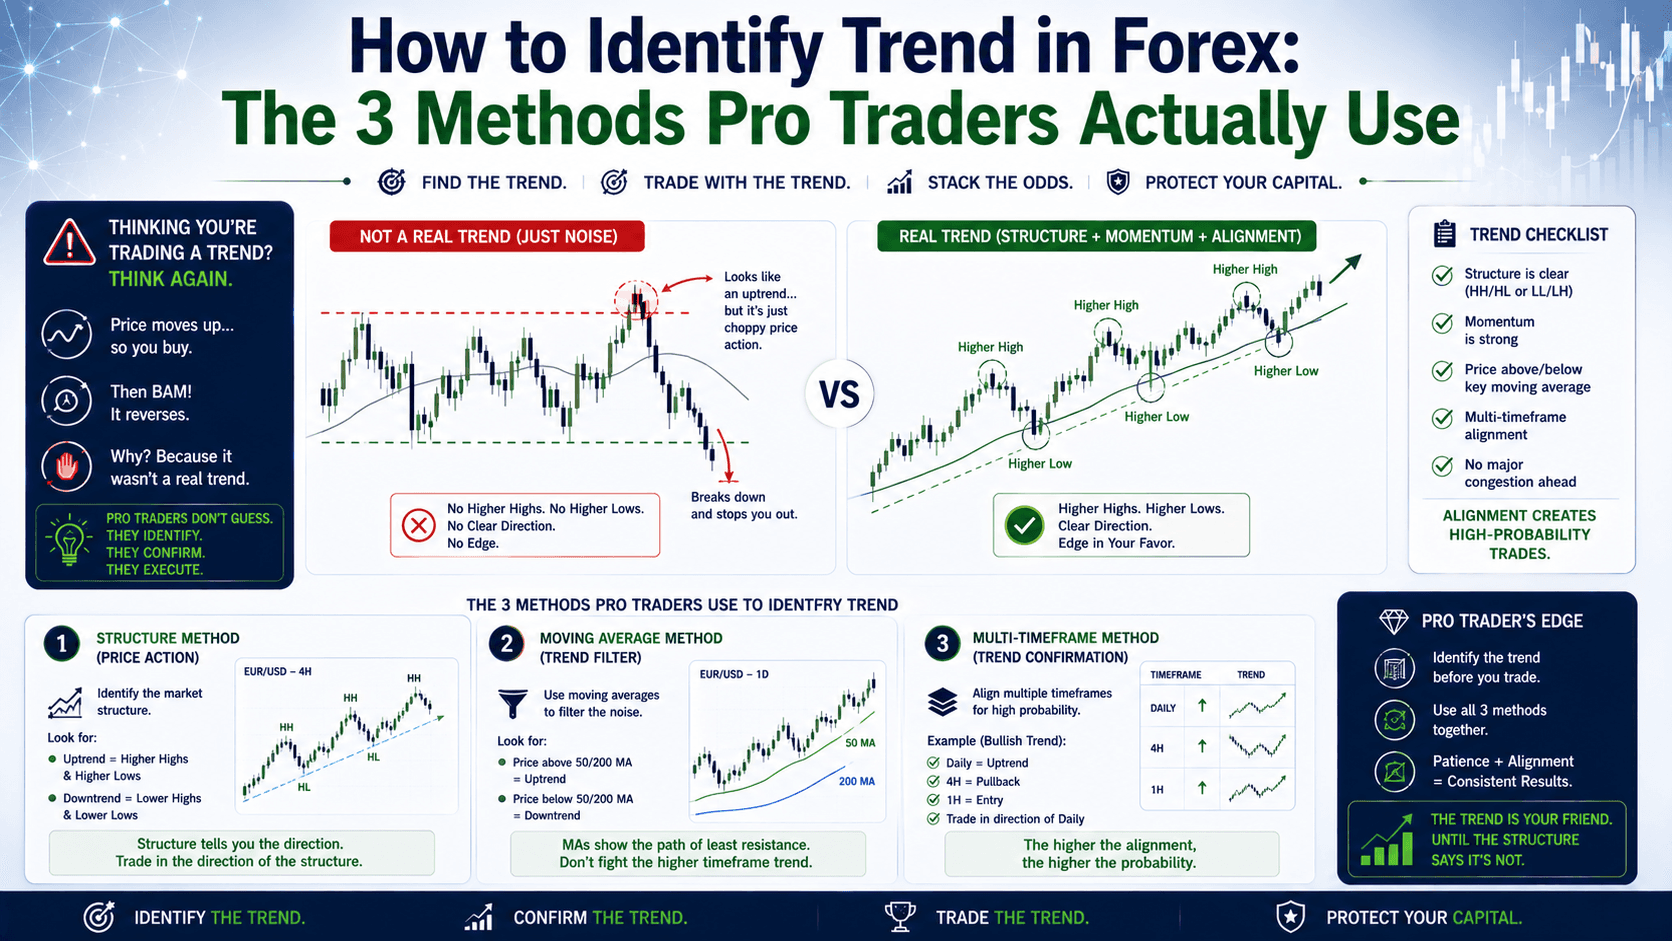

Thinking You're Trading a Trend? Think Again.
Ever been in a trade that felt "right" – you saw price moving up, so you bought. Then, BAM! It reverses, stops you out, and keeps going in the opposite direction. You thought you were trading with the trend, but the market had other plans.
It's a classic trap, and I fell into it too, more times than I care to admit. The truth is, "spotting a trend" isn't about guessing. It's about a systematic, analytical approach. Many beginners get caught trying to predict reversals or jumping into a trend too late, costing them real money. Without clear trend identification, you're essentially gambling.
But here's the deal: identifying trends isn't complicated. It just needs a framework. Today, we're breaking down the most effective ways to spot genuine market direction, without the guesswork. We'll show you what works, why it works, and how to apply it.
No more hoping. Just clarity.
Let's dive in.
Why Identifying the Trend is Your Account's Best Friend
The saying "the trend is your friend" isn't just a catchy phrase – it's a foundational principle. Trying to trade against a strong trend is like swimming upstream; exhausting and often futile. Going with the trend, however, puts the market's momentum on your side, increasing your probability of success.
Imagine this:
- Scenario A (No Trend ID): You see EUR/USD bouncing around 1.0850. You think it might go up, so you buy 0.1 lots at 1.0855 with a 20-pip stop loss at 1.0835. Price barely moves, then drops to 1.0820, stopping you out for a quick $20 loss. You had no clear reason to believe in an uptrend, just a hunch.
- Scenario B (With Trend ID): You've identified a clear uptrend using the methods below. EUR/USD pulls back to a key support area near 1.0850. You buy 0.1 lots at 1.0855 with the same 20-pip stop at 1.0835. This time, price respects the trend and rallies to 1.0905, hitting your 50-pip target for a $50 gain.
The entry price was the same, but the outcome was vastly different. That's the power of the trend. It shifts your probability from guessing to calculated risk.
Method 1: Price Action — The Higher Highs & Lower Lows Principle
Before you even think about indicators, look at the raw price action. This is the simplest, most fundamental way to identify a trend.

Uptrends: Staircase to the Sky
In an uptrend, price consistently makes:
- Higher Highs (HH): Each peak is higher than the previous peak.
- Higher Lows (HL): Each pullback finds support at a level higher than the previous low.
Downtrends: Slide into the Basement
Conversely, in a downtrend, price makes:
- Lower Highs (LH): Each rally fails to reach the previous peak.
- Lower Lows (LL): Each drop pushes below the previous low.
Why This Matters
This method helps you understand the market's overall structure without any lag. It tells you who's in charge – buyers or sellers. For example, if EUR/USD is making HHs and HLs on the 4-hour chart, you know the overall sentiment is bullish, even if the 1-hour chart is experiencing a temporary pullback. Ignoring this "big picture" price action is how traders get stopped out trying to short a strong uptrend.
Method 2: Moving Averages — Your Dynamic Trend Compass
Moving averages (MAs) are like a smoothed-out average of price over a specific period. They filter out the day-to-day "noise" and show you the underlying direction.
Single Moving Average for Direction
A simple way to use a single MA (like the 50-period Exponential Moving Average, or EMA) is:
- If price is consistently above the 50 EMA, it's generally an uptrend.
- If price is consistently below the 50 EMA, it's generally a downtrend.
Dual Moving Averages for Confirmed Crossovers
Many traders use two MAs – a "fast" one (shorter period, e.g., 20 EMA) and a "slow" one (longer period, e.g., 50 EMA or 200 SMA). The idea here is to look for crossovers:
- Bullish Crossover: The fast MA crosses above the slow MA. This signals a potential new uptrend.
- Bearish Crossover: The fast MA crosses below the slow MA. This signals a potential new downtrend.
Let's say GBP/USD is trending sideways around 1.2650. Suddenly, the 20 EMA at 1.2660 crosses above the 50 EMA at 1.2655. You might interpret this as an early signal to consider long trades. A buy at 1.2670 with a 30-pip stop loss could target 1.2730, aiming for $60 on 0.1 lots. This specific numerical trigger gives you a quantifiable entry point.
While effective, moving average crossovers are a lagging indicator. They confirm a trend *after* it's already started, which means you might miss the very beginning. They also perform poorly in choppy, sideways markets, generating false signals.
SMA vs EMA: Which One Wins?
When choosing your moving average, you'll encounter two main types: Simple Moving Averages (SMA) and Exponential Moving Averages (EMA). Each has its strengths and weaknesses for trend identification.
| Feature | Simple Moving Average (SMA) | Exponential Moving Average (EMA) |
|---|---|---|
| Calculation | Averages all prices equally over the period. | Gives more weight to recent prices. |
| Reaction Speed | Slower to react to price changes. | Faster to react to price changes. |
| Signal Frequency | Fewer, but potentially more reliable signals. | More, but potentially more false signals. |
| Best For | Identifying longer-term, established trends; smoother visual. | Identifying shorter-term trends; more responsive to shifts. |
| Lag | Higher lag (confirms trends later). | Lower lag (confirms trends earlier). |
The data suggests that if you're looking for early entry or scalp trades, an EMA (like the 20 or 50 EMA) will give you quicker signals. However, for swing traders or those holding positions longer, a slower SMA (like the 200 SMA) might provide a clearer, more stable picture of the overarching trend, filtering out minor fluctuations.
Method 3: Trend Lines — Drawing the Market's Boundaries
Trend lines are straight lines drawn directly on your chart, connecting key price points. They visually represent the direction and strength of a trend and act as dynamic support or resistance.
How to Draw Them Right
Most beginners just draw lines wherever they feel like it, making the market fit their line. Don't do that. Here's the correct approach:
- For an Uptrend: Connect at least two (ideally three or more) significant higher lows. The line should be drawn below the price action.
- For a Downtrend: Connect at least two (ideally three or more) significant lower highs. The line should be drawn above the price action.
The more touches a trend line has, the more significant and reliable it becomes. Extend the line into the future; this is where it can act as a predictive tool. Price often bounces off these lines, presenting entry or exit opportunities.
Common Trap: Forcing the Fit
Imagine EUR/USD is trending up, but you draw a trend line that cuts through several candle bodies just to make it touch a third low. That's a forced line. A valid trend line should touch the extreme wicks/bodies without cutting through the majority of the price action. If it doesn't fit naturally, it's not a valid trend line.
What happens when a valid trend line breaks? It often signals a potential change in trend direction or a shift into a consolidation phase. For example, if XAU/USD (Gold) has been respecting an ascending trend line for days, bouncing off it at $2350, $2365, and $2380. A strong candle breaking and closing below $2375 (the current trend line level) could signal the uptrend is weakening or reversing. This tells you to be cautious with long positions or look for shorts.
Comparing Trend Identification Tools: Which One for You?
Each method has its place. The best approach often involves combining them.
| Method | Description | Best For | Pros | Cons |
|---|---|---|---|---|
| Higher Highs/Lows | Analyzing raw price structure to find patterns of peaks & troughs. | Confirming market structure, identifying early shifts. | No lag, universal, forms basis of all patterns. | Can be subjective, requires practice to identify clearly. |
| Moving Averages | Smoothed average of price data over time. Often used in pairs (crossovers). | Confirming established trends, dynamic S/R. | Objective visual, clear buy/sell signals on crossovers. | Lagging indicator, prone to false signals in ranging markets. |
| Trend Lines | Straight lines connecting significant highs or lows. | Visualizing trend direction, dynamic S/R, potential breakout alerts. | Simple to draw, provides clear boundaries. | Can be subjective to draw, less reliable if too steep or forced. |
An extra tool to consider for trend direction is the ADX indicator. While primarily known for measuring trend strength, its +DI and -DI lines can indicate direction. If the +DI (bullish) is above the -DI (bearish), an uptrend is in play. If -DI is above +DI, it's a downtrend. When the lines are intertwined, it suggests a range. This quantitative data adds another layer of analytical confirmation.
FAQ
Is trading with the trend always profitable?
No, trading with the trend isn't always profitable. While it increases your probability, no strategy guarantees wins. Trends can reverse unexpectedly, and false signals occur. Proper risk management and knowing when a trend is ending are crucial.

How often should I check for a trend?
The frequency depends on your trading style. Scalpers might check 5-minute charts, while swing traders look at 4-hour or Daily. Always check a higher timeframe (e.g., Daily) for the overall trend, then a lower one (e.g., 1-hour) for entry signals.
Can I identify trends on any timeframe?
Yes, trends exist on all timeframes, from 1-minute to monthly. However, lower timeframe trends are more susceptible to "noise" and reversals. Higher timeframe trends are generally more reliable and powerful.
What's the best indicator to identify trend?
There isn't one single "best" indicator. Combining price action (higher highs/lows) with a lagging indicator like moving averages and a visual tool like trend lines offers a more robust and reliable approach than relying on any single tool.
Quick Recap
- Price action (Higher Highs/Lows) is the most fundamental way to spot trends without lag.
- Moving Averages (especially dual MA crossovers) provide objective, albeit lagging, trend confirmation.
- Trend lines offer visual dynamic support/resistance and signal potential trend changes.
- No single tool is perfect; combine methods for stronger confirmation.
- Always manage your risk, even when trading with a clear trend.
Your Quick Win: Spot the Trend Today
Open your trading chart right now. Pull up EUR/USD on the 4-hour timeframe. First, use your naked eye to identify the most recent 3-5 Higher Highs/Higher Lows (or Lower Highs/Lower Lows). Then, draw a trend line connecting those points. Finally, add a 20 EMA and a 50 EMA. See how they confirm or contradict each other? Practice this daily for 5 minutes, and you'll quickly train your eye to spot trends like a pro.


