Price Action
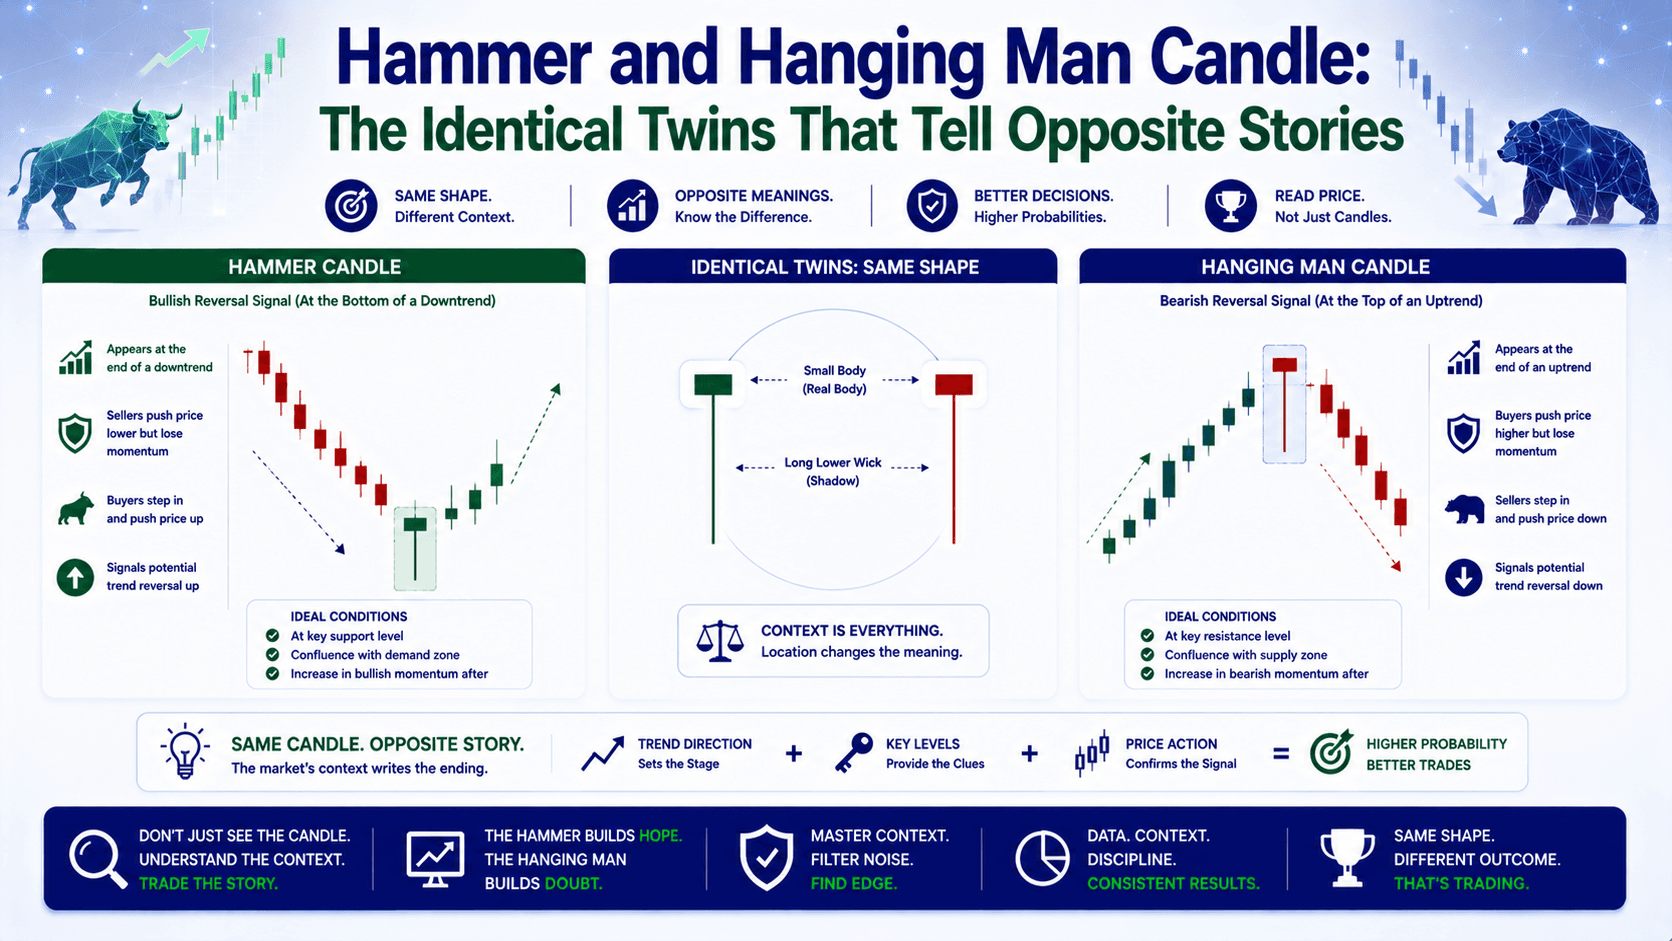
Hammer and Hanging Man Candle: The Identical Twins That Tell Opposite Stories
Two Candles, One Shape, Completely Different Meanings Let me show you something that confuses almost every new trader. Look at a chart. You see a candle with a...
00
Price Action
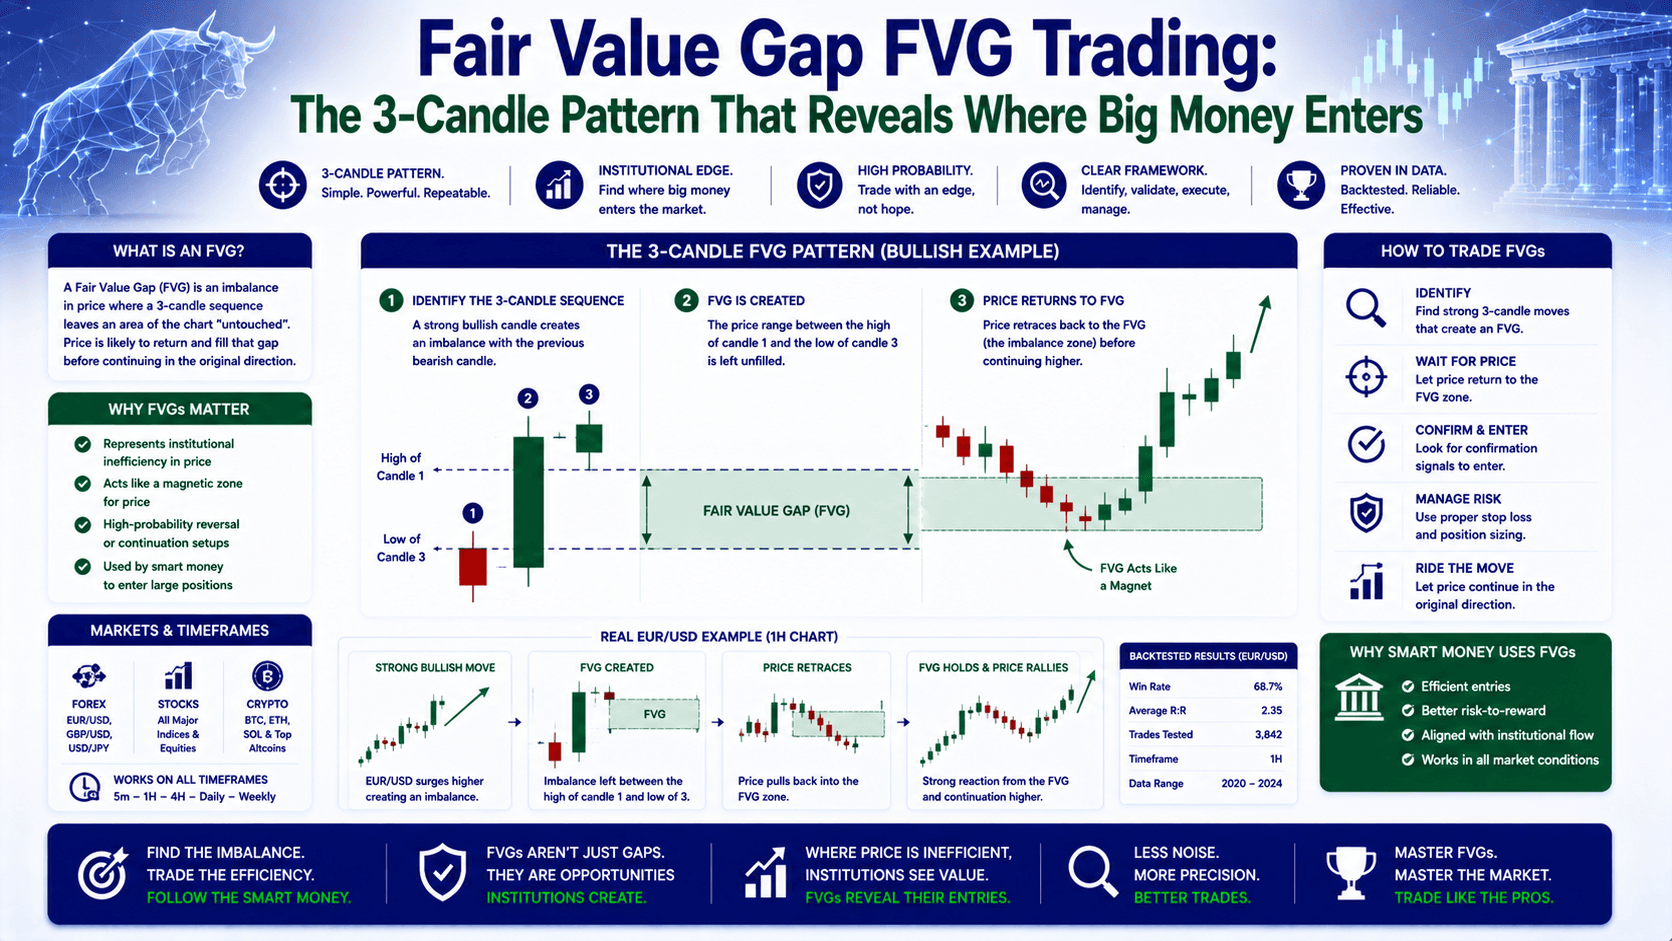
Fair Value Gap FVG Trading: The 3-Candle Pattern That Reveals Where Big Money Enters
Here’s the problem most traders face with FVGs You see a big green candle on your chart. Price rips higher. Then it pulls back. You think, "Should I buy the...
00
Price Action
Engulfing Candle Pattern Bullish Bearish: The Complete Guide to Trading These Powerful Reversal Signals
What Exactly Is an Engulfing Candle Pattern? Let's cut through the noise. An engulfing candle pattern is a two-candle formation that signals a potential market...
00
Price Action
Doji Candlestick Meaning — The 3 Types That Actually Predict Reversals (With Data)
What Does a Doji Candlestick Actually Tell You? Let's start with a scenario you've probably lived through. You're watching EUR/USD at 1.0920. It's been...
00

Price Action
Change of Character CHoCH Explained: The Market Structure Shift That Tells You When the Trend Is Dying
When Your Trade Suddenly Turns Against You — That's a CHoCH You Missed You're in a beautiful uptrend. EUR/USD has been printing higher highs and higher lows...
00
Chart Patterns
Triple Top and Triple Bottom — The 3-Test Reversal Patterns Most Traders Miss
Why Triple Tops and Triple Bottoms Are Different From Every Other Reversal Pattern You've seen the double top. Price hits resistance, pulls back, hits it...
00
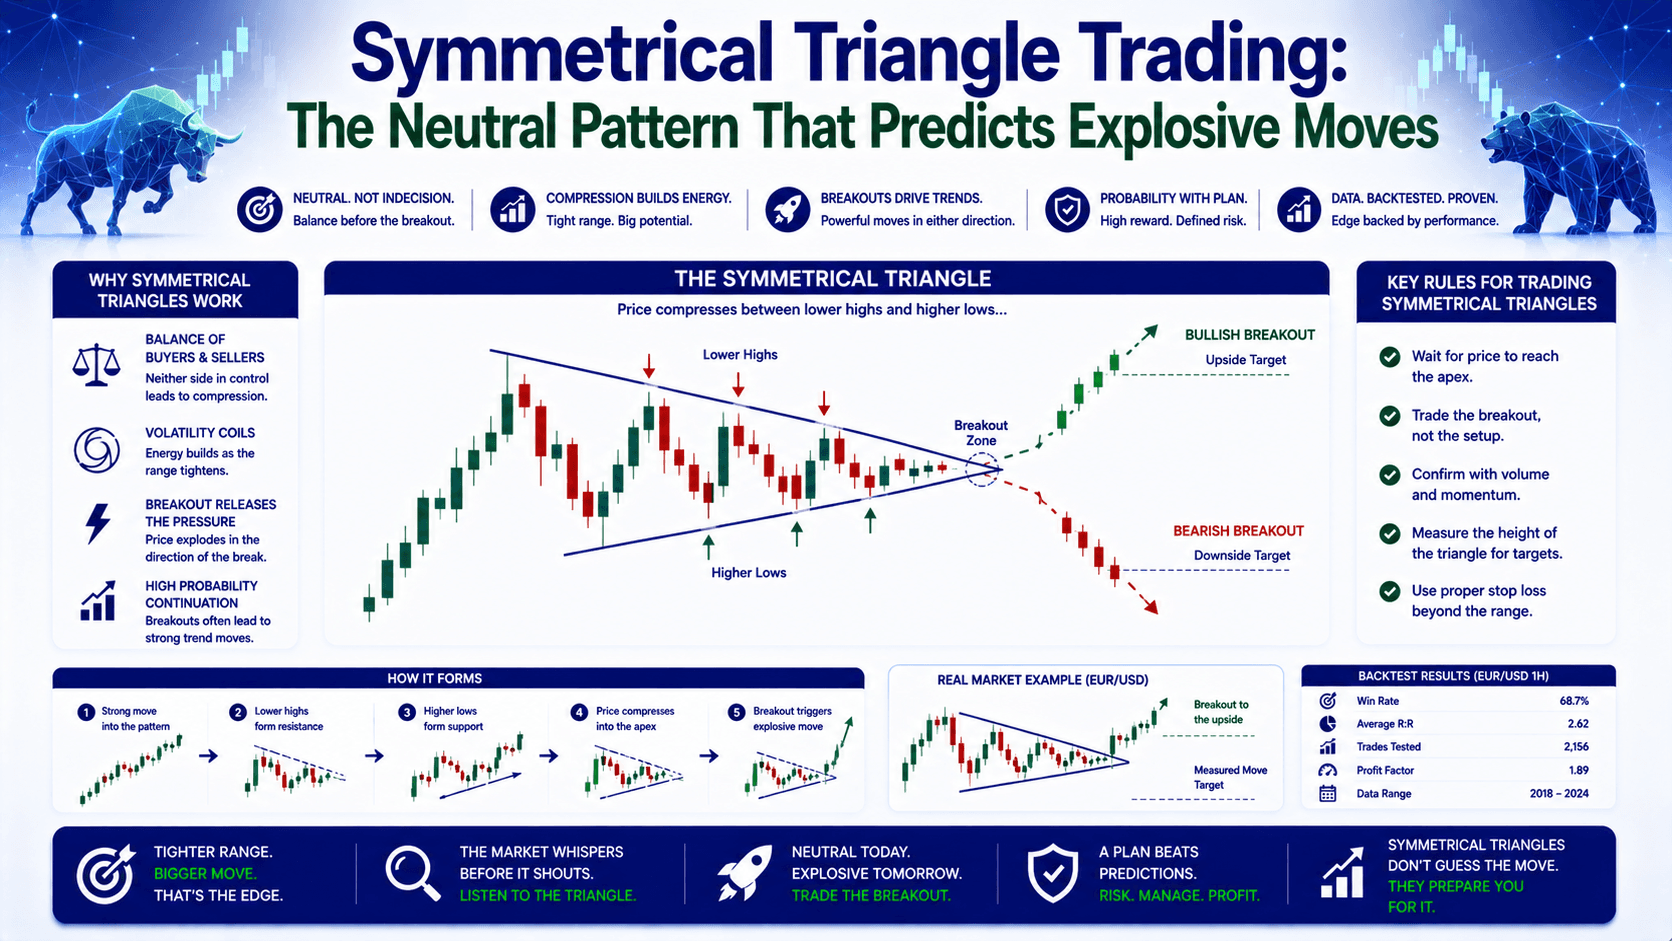
Chart Patterns
Symmetrical Triangle Trading: The Neutral Pattern That Predicts Explosive Moves
Symmetrical Triangle Trading: The Setup That Catches Big Breakouts You see price compressing into a tighter and tighter range. Lower highs. Higher lows. It...
00

Chart Patterns
Rounding Bottom Pattern: The Complete Guide to Trading This Bullish Reversal Setup
What Is the Rounding Bottom Pattern? The rounding bottom pattern is a bullish reversal formation that looks like a "U" shape on your chart. It signals the end...
00
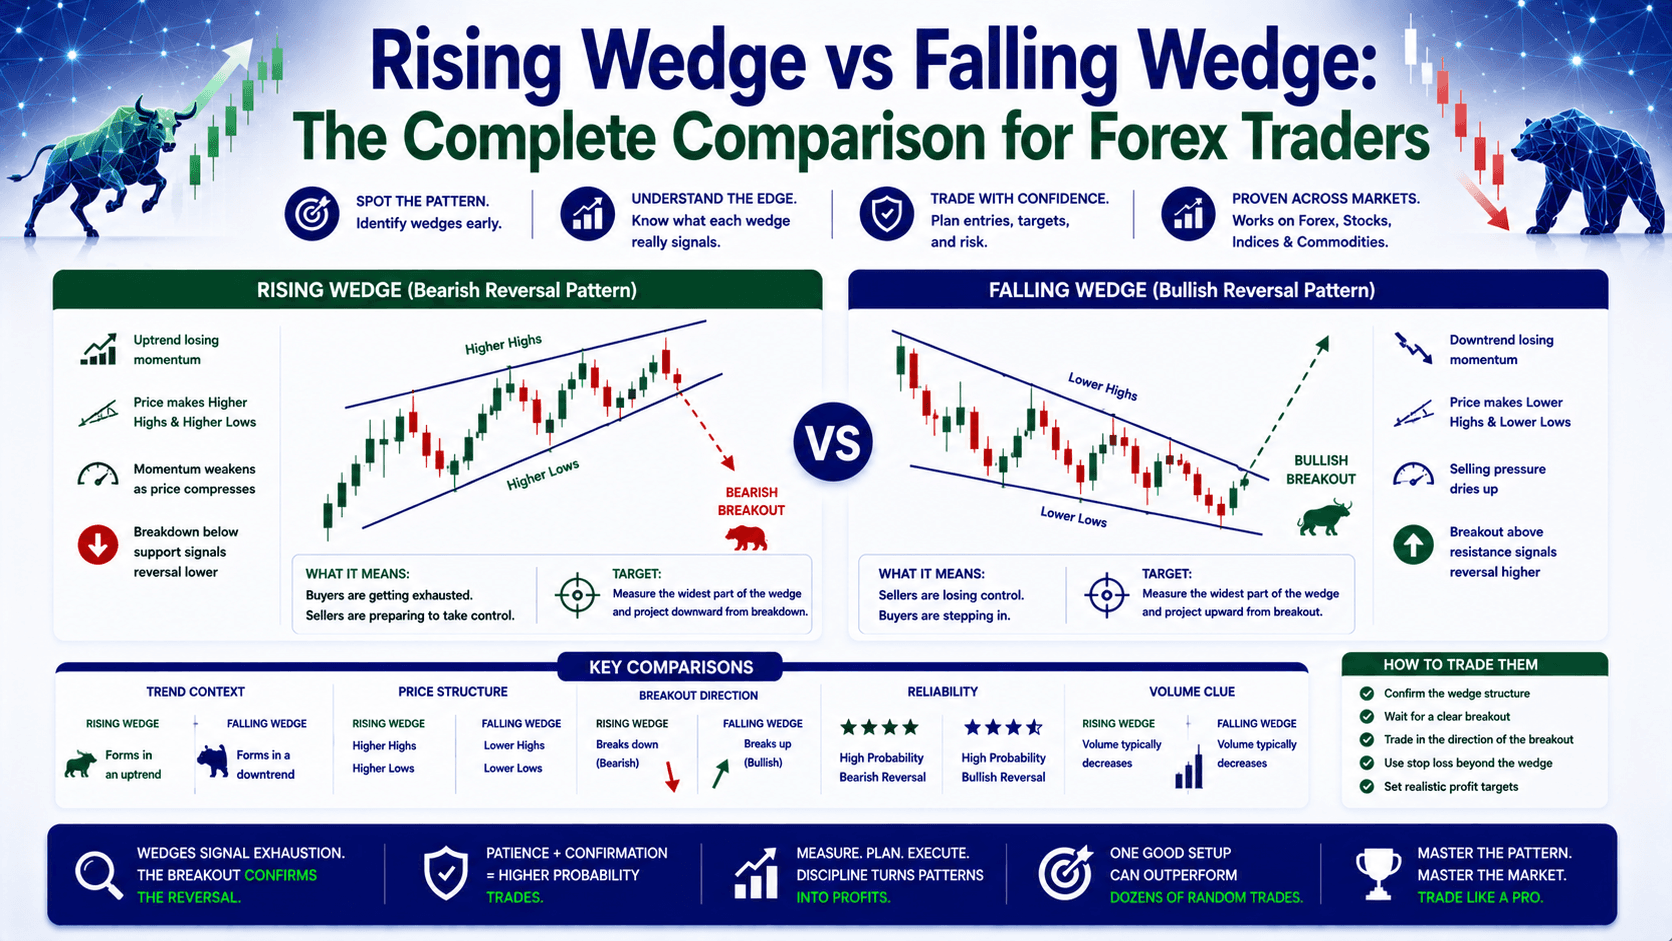
Chart Patterns
Rising Wedge vs Falling Wedge: The Complete Comparison for Forex Traders
Rising Wedge vs Falling Wedge — Which One Predicts a Reversal? You spot a wedge forming on your chart. The lines are converging. Price is compressing....
00