
Here’s the problem most traders face with FVGs
You see a big green candle on your chart. Price rips higher. Then it pulls back. You think, "Should I buy the dip?" So you do. And price keeps falling — right through your entry, through your stop loss, and into the red.
Sound familiar?
That pullback wasn't random. It was price returning to a fair value gap (FVG) — an area where the market left an imbalance. And the way you reacted to it (or didn't) made all the difference between a profitable trade and a losing one.
Let's break down exactly what fair value gap FVG trading is, how to spot these zones, and — more importantly — how to trade them without getting faked out.
What Is a Fair Value Gap (FVG) in Trading?
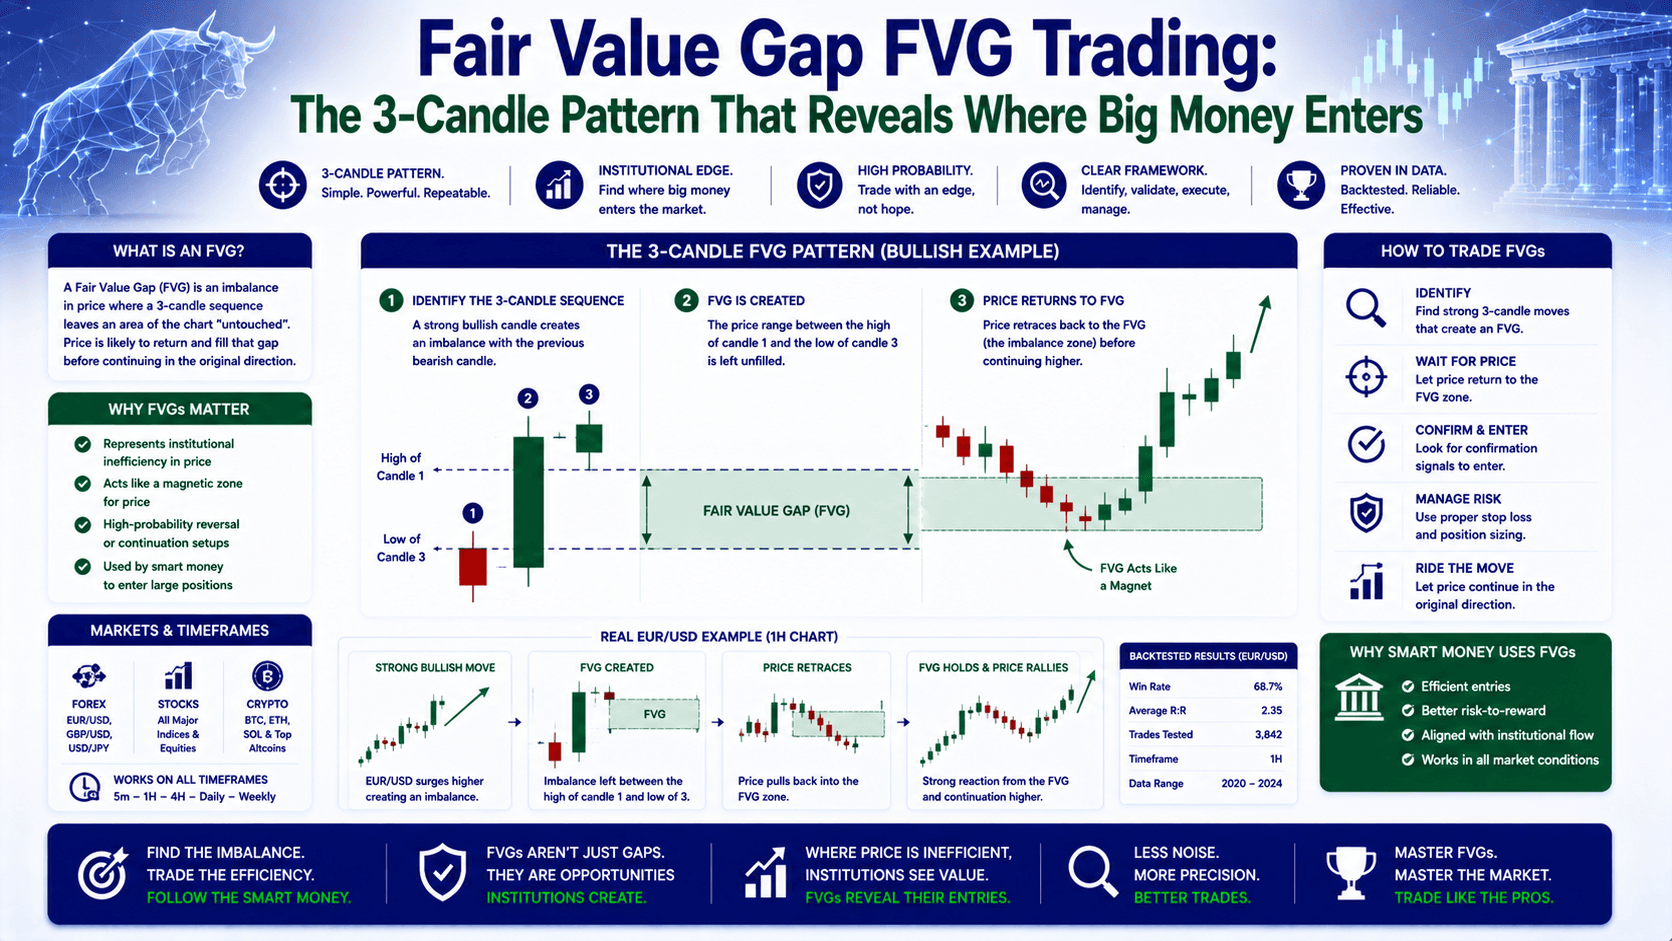
A fair value gap is a 3-candle pattern that shows a price imbalance on your chart. It happens when a large candle's range isn't fully overlapped by the candles on either side of it. The gap between those wicks is the FVG — an area where price moved too fast, leaving a "hole" in the market.
Think of it like this: imagine a busy highway. Normally, cars flow smoothly. Then a VIP convoy speeds through, and for a few seconds, there's a gap in traffic. Later, cars rush to fill that empty space. That's your FVG.
In trading, price often returns to these gaps to "fill" them before continuing in the original direction. That's the entire premise of fair value gap FVG trading — waiting for price to revisit the imbalance, then entering with the trend.
Bullish vs Bearish FVG: How to Spot Each One
Let's compare the two types side by side.
| Feature | Bullish FVG | Bearish FVG |
|---|---|---|
| Candle pattern | Large green (bullish) candle in the middle | Large red (bearish) candle in the middle |
| Gap location | Between left candle's high and right candle's low | Between left candle's low and right candle's high |
| What it signals | Buyers overwhelmed sellers — price jumped too fast | Sellers overwhelmed buyers — price dropped too fast |
| Expected reaction | Price retraces into the gap, then bounces higher | Price retraces into the gap, then drops lower |
| Invalidation | Price closes below the gap's bottom | Price closes above the gap's top |
Here's the key rule: for a valid FVG, the left candle's high and right candle's low must not overlap. If they do, there's no gap — just normal price action.
Bullish FVG Example
Let's say EUR/USD is at 1.0850. You see:
- Candle 1 (left): closes at 1.0845, high at 1.0852
- Candle 2 (middle): a big green candle, high at 1.0880, low at 1.0855
- Candle 3 (right): closes at 1.0875, low at 1.0860
The left candle's high is 1.0852. The right candle's low is 1.0860. That's 8 pips of non-overlapping space between them — that's your bullish FVG.
When price pulls back into that 1.0852–1.0860 zone, you're watching for a bounce to go long.
Bearish FVG Example
Now imagine GBP/USD at 1.2700. You see:
- Candle 1 (left): closes at 1.2710, low at 1.2695
- Candle 2 (middle): a big red candle, high at 1.2705, low at 1.2660
- Candle 3 (right): closes at 1.2670, high at 1.2680
The left candle's low is 1.2695. The right candle's high is 1.2680. That's 15 pips of non-overlapping space — your bearish FVG.
When price rallies back into that 1.2680–1.2695 zone, you're watching for a rejection to go short.
Why Do FVGs Form? The Theory Behind the Pattern
FVGs aren't random. They're caused by institutional order flow — big banks, hedge funds, or smart money entering positions in a hurry.

Here's the scenario: a large buy order hits the market. Price spikes 20 pips in 3 minutes. Retail traders who were waiting for a pullback missed the move. But the institutions that caused the spike? They couldn't fill their entire order at one price. Some of their orders got left behind in that gap — and they need price to come back so they can finish filling them.
That's why price returns to the FVG. It's not magic. It's big money finishing what they started.
⚠️ Common trap: Not every FVG gets filled. If the momentum is too strong, price can blow right through the gap and keep going. Always use a stop loss.
How to Trade FVGs: A Step-by-Step Framework
Here's a simple 4-step process for fair value gap FVG trading that works across forex, gold, and indices.
Step 1: Identify the FVG on a Higher Timeframe
Start with the 1-hour or 15-minute chart. Look for the 3-candle pattern. Use an FVG indicator if your platform has one — it saves time and reduces mistakes.
For example, on XAU/USD (Gold), you spot a bullish FVG between $2,345 and $2,350 on the 1-hour chart.
Step 2: Drop to a Lower Timeframe for Entry
Switch to the 5-minute or 1-minute chart. Wait for price to enter the FVG zone.
Don't buy the moment price touches the gap. Wait for confirmation — a rejection candle, a bullish engulfing pattern, or a hammer at the FVG level.
Step 3: Enter With a Defined Stop Loss
Place your entry at the confirmation candle's close. Put your stop loss just below the FVG's bottom (for a bullish setup) or above the FVG's top (for a bearish setup).
Example: Gold bullish FVG at $2,345–$2,350. You enter at $2,348 after a rejection candle. Stop loss at $2,343 (2 pips below the gap). Target: $2,370 (the next resistance level).
Step 4: Manage the Trade
If price fills the gap and bounces, let it run toward your target. Move your stop to breakeven once price moves 1:1 risk-to-reward.
If price closes below the FVG's bottom (for a bullish setup), the gap is invalidated. Exit immediately.
FVG vs Support & Resistance: Which One Wins?
Here's the honest comparison:
| Factor | Fair Value Gap (FVG) | Support & Resistance (S&R) |
|---|---|---|
| Formation speed | Forms in 3 candles — fast | Takes multiple touches to establish |
| Precision | Narrow zone (often 5-15 pips) | Wider zone (10-30+ pips) |
| Reliability | Higher when near S&R | Higher with more touches |
| Best use case | Scalping, intraday entries | Swing trading, broader analysis |
| Weakness | Can be invalidated quickly | Lagging — forms after the move |
The data suggests combining both. An FVG that aligns with a key support or resistance level is significantly more reliable than one that sits in the middle of nowhere.
Inverse Fair Value Gaps (IFVGs): When the Gap Flips
An inverse fair value gap (IFVG) happens when price breaks through an FVG instead of bouncing off it. This changes the gap's character — a bullish FVG becomes a supply zone (resistance), and a bearish FVG becomes a demand zone (support).
Example: You had a bullish FVG on EUR/USD at 1.0840–1.0850. Price drops below 1.0840 and closes there. That FVG is now invalid as support. Instead, it becomes a resistance zone. If price rallies back to 1.0840–1.0850, you'd look to short, not buy.
IFVGs are powerful reversal signals, especially when combined with market structure breaks.
Best Timeframes and Assets for FVG Trading
Best timeframes: 15-minute and 1-hour charts give the best balance of speed and reliability. Lower timeframes (1-minute, 5-minute) have more noise. Higher timeframes (4-hour, daily) form less frequently but are more reliable.

Best assets: High-liquidity instruments work best — EUR/USD, GBP/USD, USD/JPY, and XAU/USD (Gold). These markets have enough volume for FVGs to form and fill predictably. Crypto can work but expect more erratic behavior.
FAQ
Is fair value gap FVG trading profitable?
It can be, but no strategy guarantees profits. FVGs give you a high-probability entry zone. Your profitability depends on risk management, stop loss placement, and combining FVGs with other tools like support/resistance or market structure.
How do I find FVGs on my chart?
Look for a 3-candle pattern where the middle candle is large and its range doesn't fully overlap with the candles on either side. Most trading platforms like TradingView or MetaTrader have FVG indicators that mark them automatically.
What's the difference between an FVG and a regular gap?
A regular gap is a price jump between two consecutive candles — often seen on daily charts after news events. An FVG is a gap within a 3-candle pattern on any timeframe, caused by imbalance in order flow, not a market closure.
Can I trade FVGs on lower timeframes?
Yes, but expect more false signals. The 5-minute chart works for scalping, but you need tight stop losses and quick execution. The 1-hour chart is more forgiving for beginners.
Quick Recap
- FVG = a 3-candle pattern showing a price imbalance where big money likely entered
- Bullish FVG: gap between left candle's high and right candle's low — expect a bounce higher
- Bearish FVG: gap between left candle's low and right candle's high — expect a drop lower
- Invalidation: price closes through the gap — exit the trade
- Best used with: support/resistance, market structure, and higher timeframe analysis
Quick Win: Find Your First FVG in 5 Minutes
Open your chart right now. Pull up EUR/USD on the 15-minute timeframe. Scroll back 2-3 hours. Look for a sequence of 3 candles where the middle one is noticeably larger than its neighbors. Check if the left candle's high and right candle's low don't overlap. If they don't — congratulations, you found an FVG. Mark it. Watch how price reacts when it returns to that zone. Do this 5 times, and you'll start seeing them everywhere.


