
Rising Wedge vs Falling Wedge — Which One Predicts a Reversal?
You spot a wedge forming on your chart. The lines are converging. Price is compressing. Something big is about to happen.
But which way is it going to break?
Here's the problem most traders face: they see a wedge and assume it's a reversal pattern. They short the rising wedge immediately. Or they buy the falling wedge the second it forms.
And then price does the opposite. Their stop gets taken. They watch the move without them.
Sound familiar?
The difference between a profitable wedge trade and a losing one comes down to understanding rising wedge vs falling wedge — not just what they look like, but how to trade them with real numbers and real risk management.
Let's break it down.
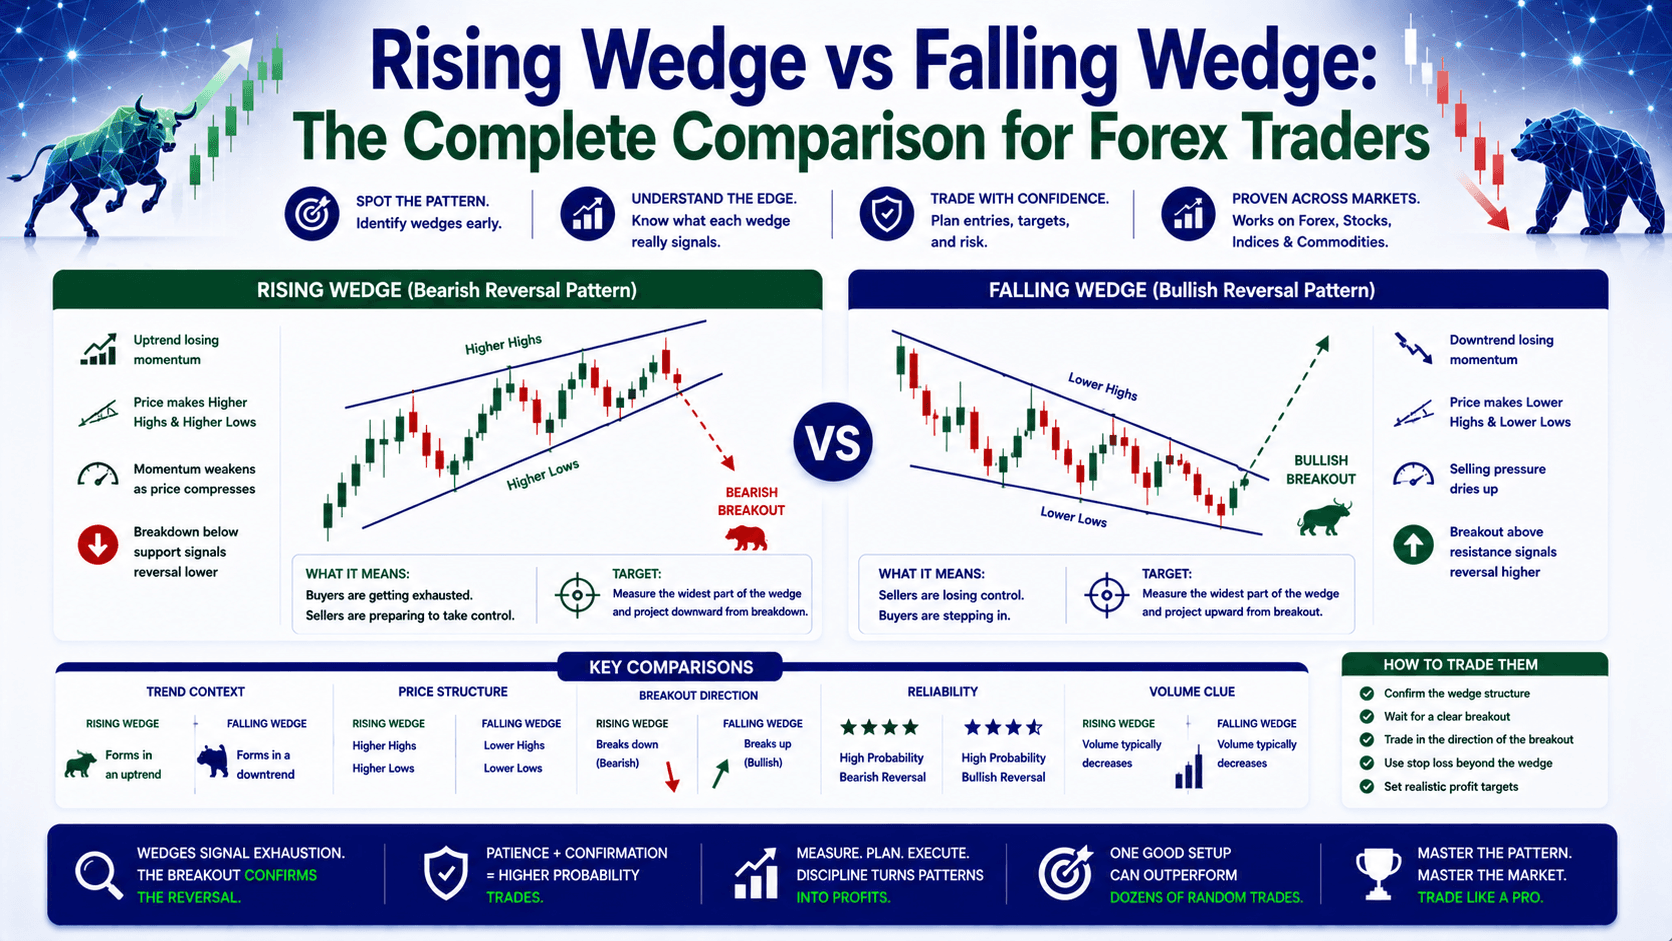
What Is a Rising Wedge? (The Bearish Signal)
A rising wedge forms when price makes higher highs and even higher lows. The slope of the support line is steeper than the resistance line. The two trend lines converge as price moves upward.
Think of it like a spring being compressed. The market is making new highs, but each high is smaller than the last. The energy is building. Eventually, it releases — usually to the downside.
Key characteristics:
- Higher highs and higher lows
- Both trend lines slope upward
- The support line is steeper than the resistance line
- Volume typically declines as the pattern develops
- Usually signals a bearish reversal in an uptrend
Real Example: EUR/USD Rising Wedge
Let's say EUR/USD is trading at 1.0850. Over 3 weeks, it forms a rising wedge:
- Swing low 1: 1.0780
- Swing high 1: 1.0880
- Swing low 2: 1.0820 (higher low)
- Swing high 2: 1.0900 (higher high, but smaller move)
- Swing low 3: 1.0840 (even higher low)
The wedge is tightening. Price breaks below the support line at 1.0820. You wait for a retest. Price comes back to 1.0825, forms a small bearish candle, then drops to 1.0740.
On 0.1 lots: that's 80 pips × $1/pip = $80 profit.
If you had shorted at the break without waiting for the retest? You'd have entered at 1.0810 and watched price spike to 1.0835 before dropping. That 25-pip spike would have stopped you out if your stop was too tight.
What Is a Falling Wedge? (The Bullish Signal)
A falling wedge is the opposite. Price makes lower lows and even lower highs. The resistance line is steeper than the support line. Both trend lines slope downward and converge.
This pattern signals that selling pressure is exhausting. The bears are pushing price down, but each push is weaker than the last. Buyers start stepping in.
Key characteristics:
- Lower highs and lower lows
- Both trend lines slope downward
- The resistance line is steeper than the support line
- Volume typically declines as the pattern develops
- Usually signals a bullish reversal in a downtrend
Real Example: GBP/USD Falling Wedge
GBP/USD is at 1.2650 after a 2-week selloff. A falling wedge forms:
- Swing high 1: 1.2720
- Swing low 1: 1.2620
- Swing high 2: 1.2680 (lower high)
- Swing low 2: 1.2600 (lower low, but smaller move)
- Swing high 3: 1.2640 (even lower high)
Price breaks above the resistance line at 1.2660. Retests at 1.2655, then rallies to 1.2780.
On 0.1 lots: 125 pips × $1/pip = $125 profit.
Rising Wedge vs Falling Wedge: The Comparison Table
| Feature | Rising Wedge | Falling Wedge |
|---|---|---|
| Trend direction | Upward (higher highs, higher lows) | Downward (lower highs, lower lows) |
| Typical breakout | Downside (bearish) | Upside (bullish) |
| Steeper line | Support line | Resistance line |
| In an uptrend | Reversal signal | Continuation signal |
| In a downtrend | Continuation signal | Reversal signal |
| Volume pattern | Declining during formation | Declining during formation |
| Risk:Reward potential | 1:2 to 1:3 typical | 1:2 to 1:3 typical |
How to Trade Wedges: The 3-Step Framework
Step 1: Identify the Pattern Correctly
This is where most traders mess up. They see two converging lines and call it a wedge. But it's not valid unless:

- Both trend lines have at least 3 touches each (3 highs and 3 lows)
- The lines are clearly converging (not parallel)
- The pattern took at least 5-10 candles to form on your timeframe
Step 2: Wait for Confirmation
The wrong way: Short the moment price touches the lower trend line.
The right way: Wait for a close below support (rising wedge) or above resistance (falling wedge). Then wait for a retest of the broken level.
This is the Contrast Effect in action. Most beginners jump in early. Smart traders wait for confirmation and get better entries.
Step 3: Set Your Stop and Target
Stop loss placement:
- Rising wedge short: Place stop above the last swing high
- Falling wedge long: Place stop below the last swing low
Target calculation: Measure the height of the wedge at its widest point. Project that distance from the breakout level.
Example: Rising wedge on EUR/USD is 80 pips tall. Breakout at 1.0820. Target = 1.0820 - 80 pips = 1.0740.
The Wrong Way vs The Right Way
Wrong way: You see a falling wedge on USD/JPY at 149.50. You buy immediately because "falling wedge = bullish." Price drops to 148.80. You're down 70 pips. You panic and close at a loss. Price then rallies to 151.00.
Right way: You see the falling wedge. You draw the trend lines. You wait for a close above resistance at 150.00. Price closes at 150.20. You wait for a retest. Price comes back to 149.80, forms a bullish pin bar. You enter long at 149.90. Stop at 149.30 (below the last swing low). Target at 151.20 (wedge height projected).
Result: 130 pips profit on 0.1 lots = $130. Risk was 60 pips = $60. Risk:Reward = 1:2.2.
Common Mistakes Trading Wedges
Mistake 1: Forcing the pattern. Not every converging trend line is a wedge. If the lines don't have 3 touches each, it's not valid.
Mistake 2: Ignoring the trend context. A rising wedge in an uptrend is a reversal signal. A rising wedge in a downtrend is a continuation signal. Context matters.
Mistake 3: Entering at the break without a retest. Price often spikes back to test the broken level. If you enter at the break, you might get stopped out by the retest. Patience pays.
Mistake 4: Setting stops too tight. Wedges are volatile. Give your stop at least 10-15 pips of breathing room beyond the swing point.
FAQ
Is a rising wedge always bearish?
Not always. A rising wedge in an uptrend is bearish (reversal). But in a downtrend, it can signal continuation of the downtrend. Always check the trend context.

How many touches does a wedge need to be valid?
At least 3 touches on each trend line (3 highs and 3 lows). Fewer touches means the pattern is not reliable enough to trade.
What's the best timeframe for trading wedges?
The 4-hour and daily timeframes work best. Wedges on lower timeframes (1-hour or less) produce more false breakouts.
Can wedges be continuation patterns?
Yes. A rising wedge in a downtrend signals continuation of the downtrend. A falling wedge in an uptrend signals continuation of the uptrend. Context is everything.
Quick Recap
- Rising wedge: Higher highs, higher lows, bearish bias
- Falling wedge: Lower highs, lower lows, bullish bias
- Always wait for a close beyond the trend line + a retest
- Place stops beyond the last swing high/low
- Project the wedge height for your target
- Risk:Reward of 1:2 or better is achievable
Quick Win
Open your chart right now. Pull up EUR/USD on the 4-hour timeframe. Scroll back 2-3 weeks. Find the last 3 wedges that formed. Were they rising or falling? Did price break in the expected direction? Measure the height of each wedge and see if the target was hit. This 5-minute exercise will train your eyes to spot real wedges versus false ones.


