
Two Candles, One Shape, Completely Different Meanings
Let me show you something that confuses almost every new trader.
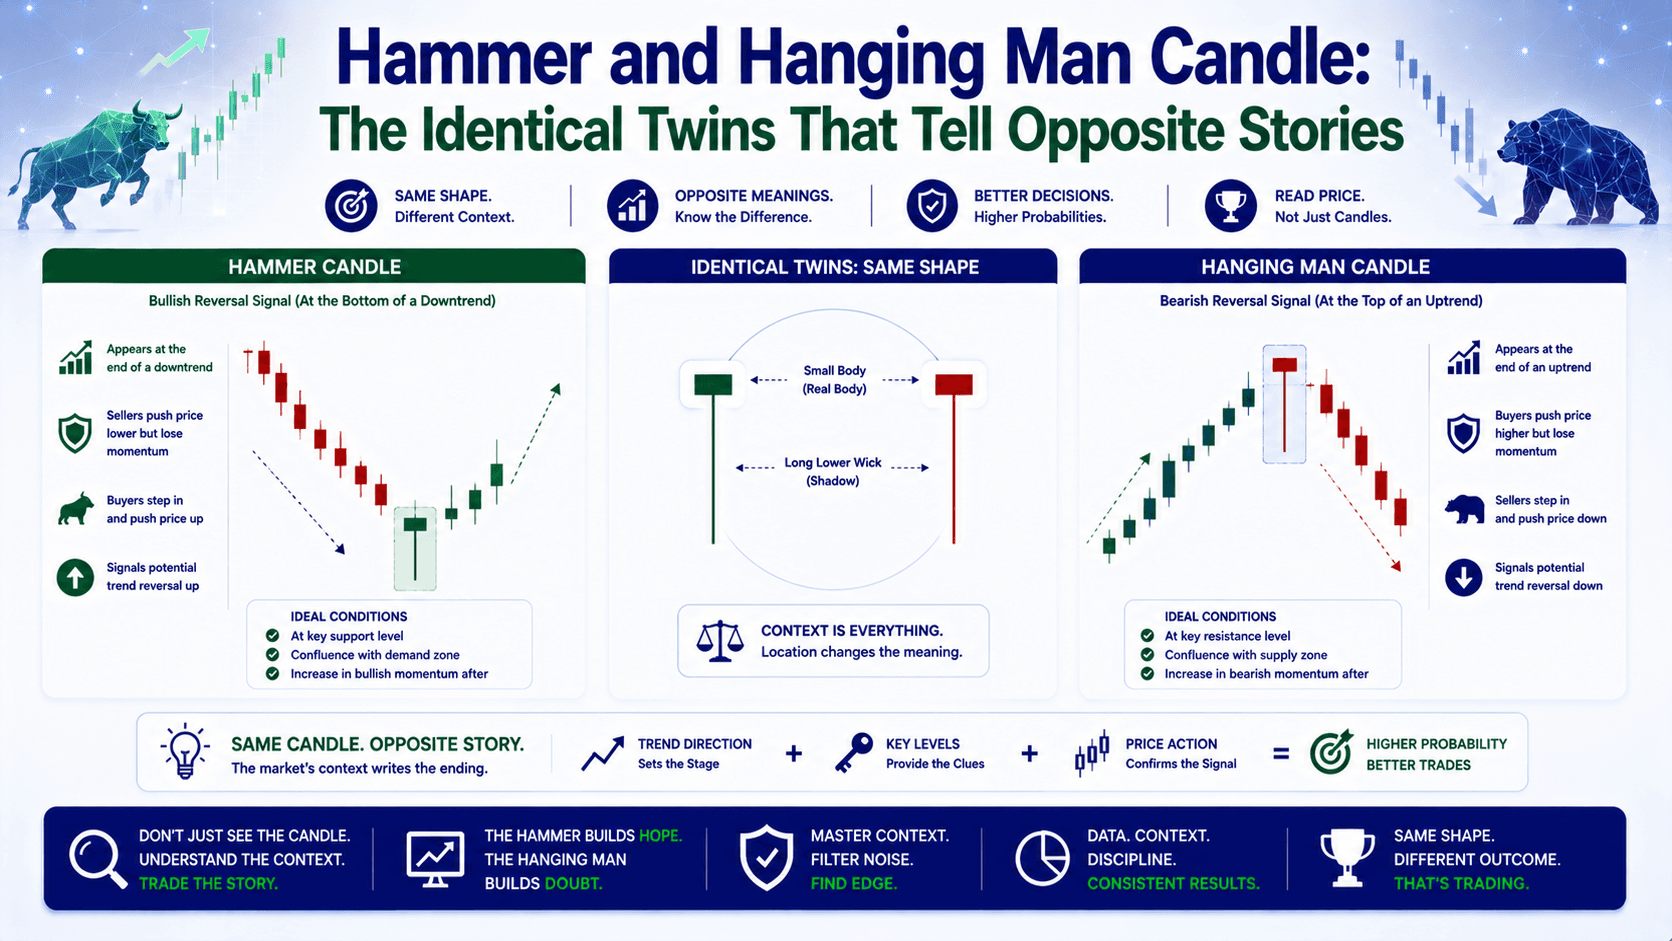
Look at a chart. You see a candle with a tiny body at the top and a long wick underneath. It looks like a hammer. You think: "Bullish reversal. Buy."
Then you see the exact same shape somewhere else. You buy again. And you get stopped out for a loss.
What happened?
You confused a hammer with a hanging man. Same shape. Opposite meaning. And the difference? It's not in the candle itself. It's in the context.
Let's break down the hammer and hanging man candle patterns so you never make that mistake again.
What Is a Hammer Candlestick?
A hammer is a bullish reversal pattern. It appears after a downtrend and signals that sellers are losing control.
Here's what it looks like:
- Small real body near the top of the candle
- Long lower shadow (at least 2x the body length)
- Little to no upper shadow
- Body can be green or red — both count
The psychology is simple. Sellers push the price down aggressively. That's the long wick. But by the close, buyers step in and push it back up near the open. The sellers tried. They failed. Momentum is shifting.
Real example: EUR/USD is at 1.0850 after a 5-day decline. A hammer forms with a low of 1.0820 and a close at 1.0848. The lower shadow is 28 pips. The body is only 2 pips. That's a 14:1 ratio — a very strong signal.
What Is a Hanging Man Candlestick?
A hanging man looks identical. Same shape. Same proportions. But it appears after an uptrend and signals a bearish reversal.
The psychology flips. During the session, buyers push price higher initially. Then sellers drive it down sharply. Buyers manage to pull it back near the open, but the damage is done. The long lower shadow shows that selling pressure entered the market.
Real example: Gold (XAU/USD) rallies from $2,350 to $2,420 over 4 days. A hanging man forms with a high of $2,422, a low of $2,405, and a close at $2,418. The lower shadow is 13 pips. The body is 4 pips. That's a warning sign that buyers are exhausted.
Hammer vs Hanging Man: The Core Difference
| Feature | Hammer | Hanging Man |
|---|---|---|
| Trend context | After a downtrend | After an uptrend |
| Signal type | Bullish reversal | Bearish reversal |
| Psychology | Sellers fail, buyers step in | Buyers tire, sellers appear |
| Best at | Support levels | Resistance levels |
| Confirmation | Next candle closes higher | Next candle closes lower |
Here's the rule that saves you money: A hammer in a downtrend is bullish. A hanging man in an uptrend is bearish. A hammer in an uptrend is NOT a hammer — it's a hanging man.

How to Trade the Hammer Pattern
Trading a hammer requires more than just seeing the shape. You need a process.
Step 1: Context Check
Confirm the hammer appears after a clear downtrend. At least 3-5 bearish candles before it. If it's in the middle of a range, skip it.
Step 2: Look for Confluence
A hammer at a known support level is stronger. A hammer with oversold RSI is stronger. A hammer with higher volume is stronger. Stack the odds.
Step 3: Wait for Confirmation
Don't buy at the close of the hammer. Wait for the next candle to close higher. This is your confirmation that buyers are following through.
Trade example: GBP/USD at 1.2650 after a 4-day drop. Hammer forms with low at 1.2620, close at 1.2648. Next candle closes at 1.2660. You enter long at 1.2660. Stop loss at 1.2615 (below hammer low). Target at 1.2710 (50 pips from entry). Risk: 45 pips. Reward: 50 pips. Risk:Reward = 1:1.1.
That's not great. So adjust your target. Move it to 1.2730 (70 pips). Now R:R = 1:1.55. Better.
How to Trade the Hanging Man Pattern
The process is the mirror image.
Step 1: Context Check
Confirm the hanging man appears after a clear uptrend. At least 3-5 bullish candles before it.
Step 2: Look for Confluence
Hanging man at resistance? Stronger. Overbought RSI? Stronger. High volume? Stronger.
Step 3: Wait for Confirmation
Wait for the next candle to close below the hanging man's body.
Trade example: USD/JPY at 152.50 after a 6-day rally. Hanging man forms with high at 152.80, low at 151.90, close at 152.45. Next candle closes at 152.20. You enter short at 152.20. Stop loss at 152.85 (above hanging man high). Target at 151.30 (90 pips from entry). Risk: 65 pips. Reward: 90 pips. R:R = 1:1.38.
Why Most Traders Get This Wrong
The most common mistake? Focusing on the shape instead of the context.
You see a hammer shape. You buy. But if that candle appeared after a 5-day rally, it's a hanging man. You just bought at the top of a potential reversal.
Here's the data from Thomas Bulkowski's research:
- Confirmed hammers lead to bullish reversals about 60% of the time on daily charts
- Confirmed hanging men lead to bearish reversals about 55% of the time
Those aren't guaranteed. But they're good enough to pay attention — especially when combined with other factors.
Combining with Other Tools
Single candles are noise. Combined patterns are signals.

| Tool | How It Helps with Hammer | How It Helps with Hanging Man |
|---|---|---|
| Support/Resistance | Confirms reversal zone | Confirms exhaustion zone |
| RSI | Oversold strengthens signal | Overbought strengthens signal |
| Volume | High volume = strong buying | High volume = strong selling |
| Moving Averages | Hammer at 50 MA = stronger | Hanging man at 200 MA = stronger |
Example: EUR/USD at 1.0850. Hammer forms. RSI is at 28 (oversold). Volume is 20% above average. The 50-day MA is at 1.0840. That's 4 layers of confluence. This is a high-probability setup.
FAQ
What is the difference between a hammer and a hanging man candle?
The shape is identical — small body at the top with a long lower shadow. The difference is context. A hammer appears after a downtrend and signals a bullish reversal. A hanging man appears after an uptrend and signals a bearish reversal.
Is a hanging man bullish or bearish?
A hanging man is bearish. It appears after an uptrend and warns that selling pressure is entering the market. Confirmation from the next candle (lower close) strengthens the signal.
Is a hammer pattern bullish or bearish?
A hammer is bullish. It appears after a downtrend and shows that buyers stepped in to reverse the selling pressure. A higher close on the next candle confirms the reversal.
Can a hammer and hanging man appear on the same chart?
Yes. A hammer at the bottom of a downtrend and a hanging man at the top of an uptrend can appear on the same chart. They simply mark different phases of the market cycle.
Quick Recap
- Hammer = bullish reversal after a downtrend
- Hanging man = bearish reversal after an uptrend
- Same shape, opposite meaning — context is everything
- Always wait for confirmation from the next candle
- Combine with support/resistance, RSI, and volume for higher probability
Quick Win: Do This Right Now
Open your chart. Pull up EUR/USD on the 4-hour timeframe. Scroll back 2 weeks. Find the last 3 candles with a lower shadow at least 2x the body. Mark whether each one appeared after a downtrend or an uptrend. If it's after a downtrend, it's a hammer. If after an uptrend, it's a hanging man. Now check what happened next. Did price reverse? This 5-minute exercise will train your eye to see context, not just shape.


