
Symmetrical Triangle Trading: The Setup That Catches Big Breakouts
You see price compressing into a tighter and tighter range. Lower highs. Higher lows. It looks like a coiled spring. You know something is about to happen — but which direction?
That's the symmetrical triangle. And if you trade it wrong, you'll get stopped out repeatedly. Trade it right, and you catch some of the biggest moves in forex.
Let's break down exactly how symmetrical triangle trading works — with real numbers, real charts, and the traps most traders miss.
What Is a Symmetrical Triangle Pattern?
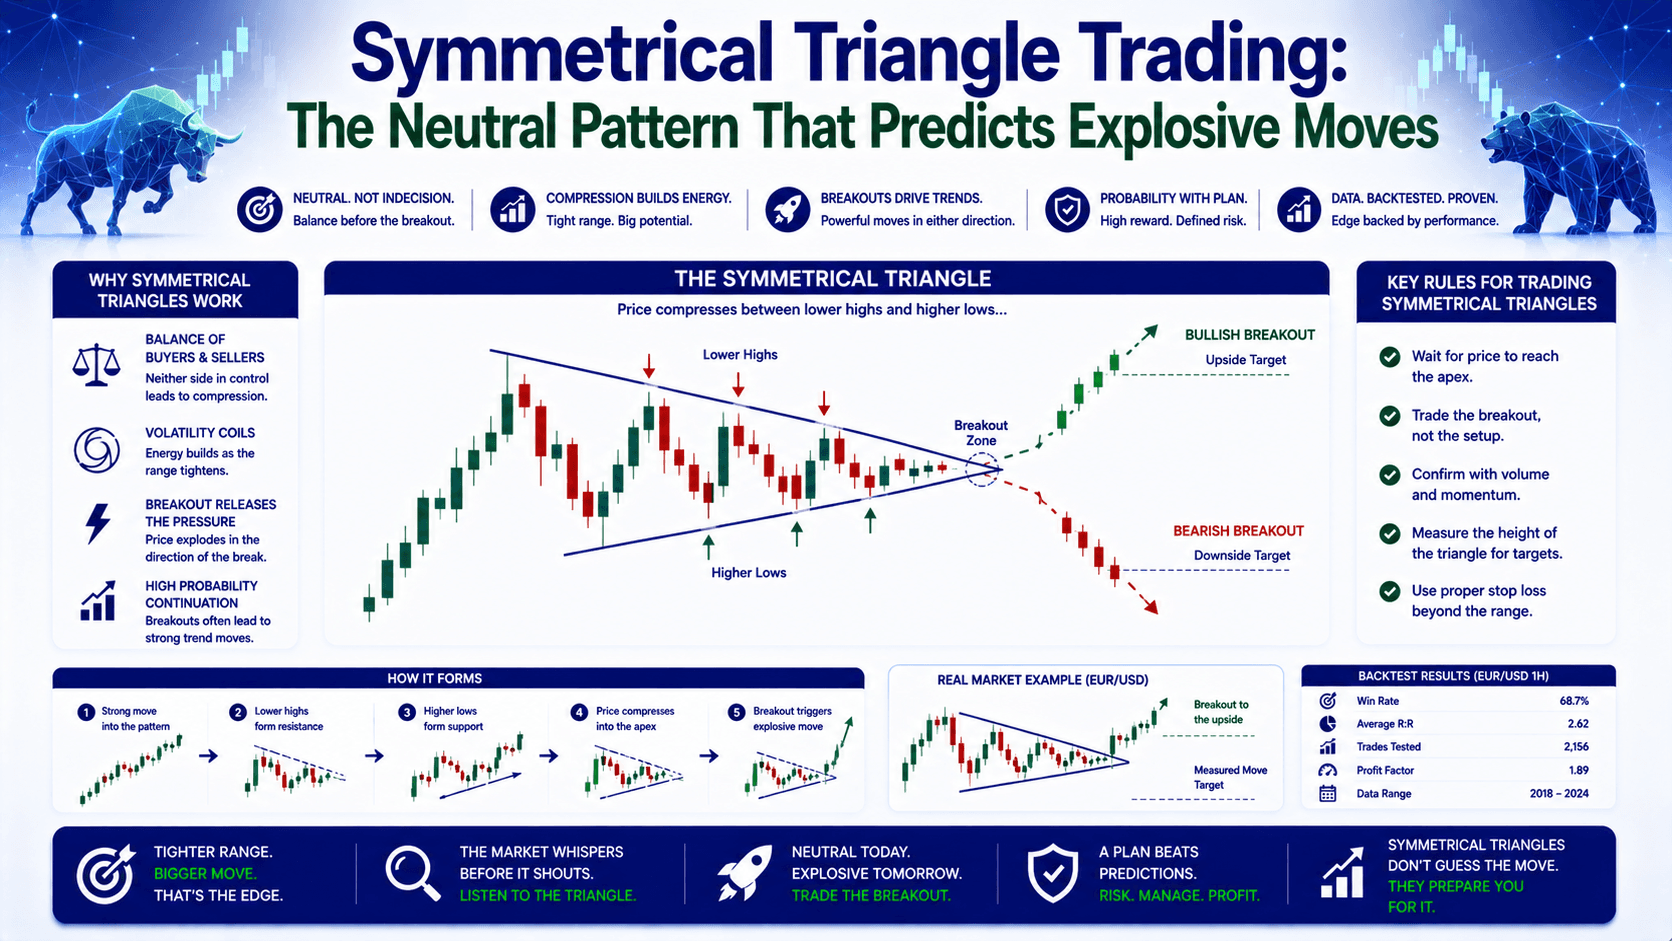
A symmetrical triangle forms when price creates a series of lower highs and higher lows. Two converging trendlines — one sloping down, one sloping up — create a triangle shape.
This pattern signals a period of consolidation. Buyers and sellers are in a tug-of-war. Neither side has control. But that balance won't last forever.
The key characteristic: the pattern is neutral. It doesn't tell you which way price will break. It only tells you a breakout is coming.
Here's the data on how they perform:
| Feature | Symmetrical Triangle | Ascending Triangle | Descending Triangle |
|---|---|---|---|
| Trendline slope | Both converging | Flat top, rising bottom | Flat bottom, falling top |
| Breakout bias | Neutral (either direction) | Bullish bias | Bearish bias |
| Volume during formation | Decreases | Decreases | Decreases |
| Volume at breakout | Increases sharply | Increases sharply | Increases sharply |
| False breakout risk | High | Moderate | Moderate |
How to Identify a Symmetrical Triangle on Your Chart
You need at least two lower highs and two higher lows to draw the converging trendlines. The pattern should have at least 4-6 touches on the lines total.
Here's what to look for:
- Upper trendline: Connects at least 2 lower highs
- Lower trendline: Connects at least 2 higher lows
- Volume: Should decrease as the pattern develops
- Duration: Can form over days, weeks, or months — longer patterns produce bigger breakouts
Let's use a real example. EUR/USD is at 1.0850. Over 10 days, it makes lower highs at 1.0900, 1.0880, 1.0865. It makes higher lows at 1.0820, 1.0835, 1.0845. The two trendlines are converging. That's your symmetrical triangle.
The Wrong Way vs The Right Way to Trade Symmetrical Triangles
The wrong way: You see the triangle forming. You guess the breakout direction based on the prior trend. EUR/USD was in an uptrend before the triangle, so you go long early. Price drops below the lower trendline. You're down 40 pips before you even realize the breakout went the other way.

The right way: You wait. You don't enter until price closes outside one of the trendlines with increased volume. That's your confirmation.
Here's the math on why patience pays:
- Entering early: You risk 30 pips on a guess. If wrong, you lose $30 on 0.1 lots.
- Waiting for confirmation: You risk 15 pips on a confirmed signal. If wrong, you lose $15 on 0.1 lots.
- The confirmed trade has half the risk and higher probability of success.
Symmetrical Triangle Trading Strategy: Step by Step
Step 1: Identify the Pattern
Find the converging trendlines on your chart. You need at least 2 touches on each line. The pattern should be clear, not messy.
Step 2: Measure the Height
Measure the widest part of the triangle — the distance between the first high and first low. This becomes your price target projection.
Example: The widest point is from 1.0900 (high) to 1.0820 (low). Height = 80 pips.
Step 3: Wait for the Breakout
Don't enter until price closes outside one of the trendlines. A close above the upper line = bullish. A close below the lower line = bearish.
Volume must increase on the breakout candle. No volume spike = higher chance of false breakout.
Step 4: Enter the Trade
For a bullish breakout: Enter long at 1.0860 (just above the upper trendline after confirmation).
For a bearish breakout: Enter short at 1.0840 (just below the lower trendline after confirmation).
Step 5: Set Stop Loss and Take Profit
Stop loss: Place it just outside the opposite trendline. For a long trade, stop below the lower trendline. Give it 5-10 pips of breathing room to avoid being stopped by noise.
Take profit: Add the triangle's height to the breakout point. For a bullish breakout at 1.0860 with 80 pip height: target = 1.0940.
Real Trade Example
Let's put it together with real numbers:
- Account: $2,000
- Risk per trade: 2% = $40
- Pattern: EUR/USD symmetrical triangle, height = 80 pips
- Bullish breakout at 1.0860
- Stop loss: 1.0830 (30 pip stop on 0.1 lots = $30 risk — under 2%)
- Take profit: 1.0940 (80 pip target on 0.1 lots = $80 profit)
- Risk:Reward = 1:2.67
If price hits target: you make $80 on a $30 risk trade. That's a 4% account gain from one trade.
The False Breakout Trap — And How to Avoid It
False breakouts are the #1 killer in symmetrical triangle trading. Price breaks the trendline, pulls you in, then reverses hard.
Here's how to filter them:
- Volume confirmation: Breakout candle volume should be at least 1.5x the average of the last 10 candles
- Close confirmation: Wait for the candle to close outside the trendline, not just spike through it
- Retest confirmation: Some traders wait for price to retest the broken trendline (now support/resistance) before entering
Let's compare the three approaches:
| Confirmation Method | Pros | Cons |
|---|---|---|
| Immediate breakout entry | Catches the full move | Highest false breakout risk |
| Close outside trendline | Good balance of risk/reward | Misses first few pips |
| Retest of trendline | Lowest false breakout risk | May miss trade entirely if no retest |
For most traders, the close outside trendline method offers the best balance.
Symmetrical Triangle vs Pennant — What's the Difference?
These two patterns look similar but have key differences:
| Feature | Symmetrical Triangle | Pennant |
|---|---|---|
| Prior move required | No — can form in sideways market | Yes — needs a sharp prior move |
| Duration | Weeks to months | Days to weeks |
| Formation | Gradual consolidation | Quick consolidation after impulse |
| Breakout direction | Neutral — can go either way | Usually continues prior trend |
| Volume pattern | Gradual decline, spike at breakout | Sharp decline, sharp spike at breakout |
If you see a sharp price move followed by a small triangle, it's a pennant. If the triangle forms without a dramatic prior move, it's a symmetrical triangle.
FAQ
Is a symmetrical triangle bullish or bearish?
Neither. It's a neutral pattern. The breakout direction determines whether it's bullish or bearish. Always wait for the breakout before taking a position.

How do you calculate the price target for a symmetrical triangle?
Measure the widest part of the triangle (the distance between the first high and first low). Add that distance to the breakout point for an upward breakout, or subtract it for a downward breakout.
What time frame works best for symmetrical triangle trading?
They work on all time frames. The 1-hour and 4-hour charts are popular for forex. Daily charts give bigger moves but require more patience. Shorter time frames have more false breakouts.
Can you trade symmetrical triangles without volume data?
Yes, but it's riskier. Without volume confirmation, use a retest of the trendline as your confirmation instead. This reduces false breakout risk.
Quick Recap
- Symmetrical triangles are neutral patterns — they don't predict direction
- Wait for a confirmed breakout with volume before entering
- Measure the widest point for your price target projection
- Place stops outside the opposite trendline with breathing room
- False breakouts are common — use volume or retest confirmation
Your Quick Win
Open your chart right now. Pull up EUR/USD on the 4-hour timeframe. Scroll back and find the last symmetrical triangle you can spot. Draw the two converging trendlines. Measure the height. Now you know exactly what to watch for next time.


