
You've Seen This Before — And It Cost You Money
EUR/USD is in a solid uptrend. Price hits 1.0920, pulls back, then hits 1.0920 again. You think "double top, time to short." You enter at 1.0918. Price drops 10 pips, then reverses and blasts through 1.0940. Your stop gets taken.
Sound familiar?
What you just experienced wasn't a failed double top. It was a tweezer top — and you traded it wrong. Let's fix that.
What Is a Tweezer Top and Bottom Pattern?
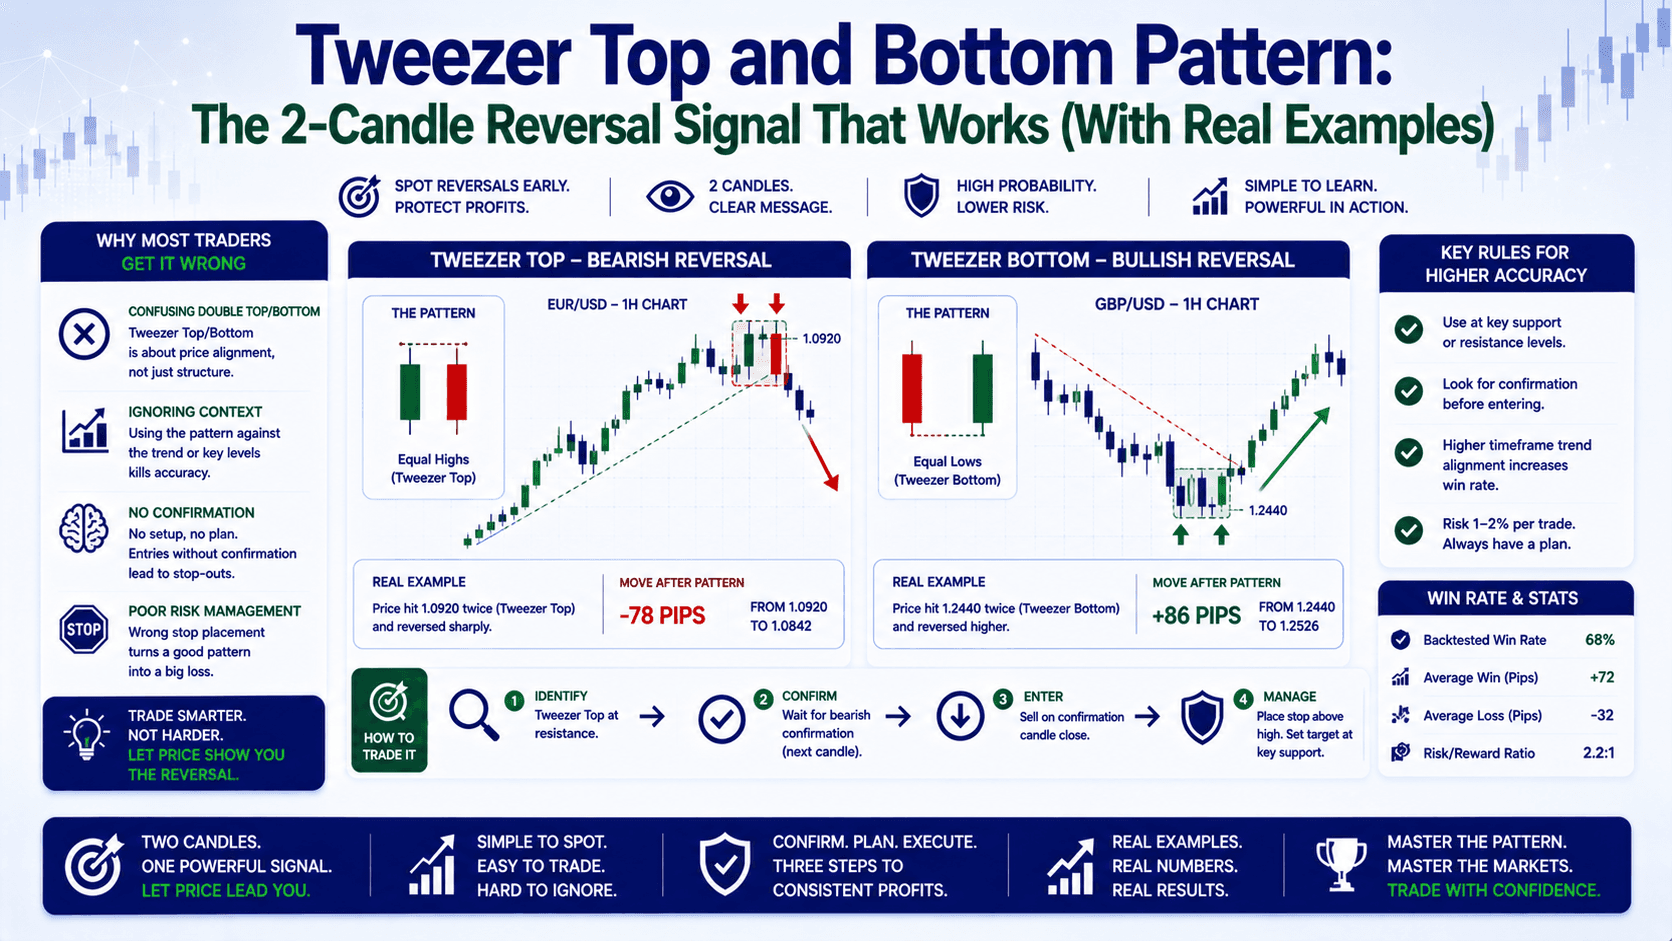
A tweezer top and bottom pattern is a 2-candle reversal formation that shows the market tried to push price to a specific level — and failed. Twice.
Here's the anatomy:
- Tweezer Top: Two candles with the SAME high. First candle is bullish. Second candle is bearish. Forms at the top of an uptrend.
- Tweezer Bottom: Two candles with the SAME low. First candle is bearish. Second candle is bullish. Forms at the bottom of a downtrend.
The key word is "same." The highs (or lows) must be nearly identical — within 1-2 pips of each other. If they're not, it's not a tweezer.
The Psychology: Why This Pattern Works
Let's compare the market dynamics for each pattern:
| Pattern | Day 1 | Day 2 | Result |
|---|---|---|---|
| Tweezer Top | Bulls push price to a new high. Close is near the high. Looks strong. | Price opens near the high, but can't push higher. Bears take over. Close is near the low. | Buyers exhausted. Sellers now in control. Bearish reversal. |
| Tweezer Bottom | Bears push price to a new low. Close is near the low. Looks weak. | Price opens near the low, but can't push lower. Bulls step in. Close is near the high. | Sellers exhausted. Buyers now in control. Bullish reversal. |
The market is telling you: "We tried to push through this level. We couldn't. Now we're going the other way."
How to Trade a Tweezer Top and Bottom Pattern — Step by Step
Let's use a real example on GBP/USD.

Scenario: Tweezer Top on GBP/USD (4-Hour Chart)
GBP/USD rallies from 1.2650 to 1.2780 over 3 days. On Day 1, a bullish candle closes at 1.2778 with a high of 1.2782. On Day 2, price opens at 1.2779, hits 1.2781, then drops sharply to close at 1.2745.
You've identified a tweezer top. Here's your trade plan:
- Entry: Sell at market after the second candle closes — around 1.2745
- Stop Loss: 2-3 pips above the tweezer high — 1.2785
- Target 1: 1.2700 (45 pips)
- Target 2: 1.2660 (85 pips)
Risk calculation (0.1 lots): 40 pip stop × $1/pip = $40 risk. If you have a $2,000 account, that's 2% risk. Acceptable.
Target 1 hit: +$45. Target 2 hit: +$85. Risk:reward = 1:2.1.
Scenario: Tweezer Bottom on XAU/USD (Daily Chart)
Gold drops from $2,380 to $2,310 over 5 days. On Day 1, a bearish candle closes at $2,312 with a low of $2,308. On Day 2, price opens at $2,310, hits $2,309, then rallies to close at $2,335.
You've identified a tweezer bottom. Trade plan:
- Entry: Buy at market after the second candle closes — around $2,335
- Stop Loss: 2-3 pips below the tweezer low — $2,305
- Target 1: $2,360 (25 pips)
- Target 2: $2,380 (45 pips)
Risk calculation (0.1 lots): 30 pip stop × $1/pip = $30 risk. Target 2 gives you $45 profit. Risk:reward = 1:1.5.
Tweezer Pattern vs. Other Reversal Patterns
Here's how the tweezer stacks up against similar formations:
| Feature | Tweezer | Engulfing | Hammer / Shooting Star |
|---|---|---|---|
| Candles needed | 2 | 2 | 1 |
| Key requirement | Same high/low | Second candle body fully engulfs first | Long wick, small body |
| Signal strength | Strong at key levels | Very strong | Moderate — needs confirmation |
| False signal rate | Low (with proper context) | Low | Higher |
| Best timeframe | 4H or Daily | Any | Any |
The data suggests: Tweezer patterns are more reliable than single-candle patterns because the second candle confirms the rejection. But they're less common than engulfing patterns.
The Wrong Way vs. The Right Way
Wrong Way
You see a tweezer top on a 15-minute chart. You short immediately. Price drops 5 pips, then continues the uptrend. Your stop gets taken.
Mistake: You used a low timeframe. Tweezer patterns are most reliable on 4-hour and daily charts. On lower timeframes, noise creates false signals.
Right Way
You see a tweezer top on a daily chart of EUR/USD. You wait for the second candle to close. You check that the pattern formed at a clear resistance level (like 1.0920, which was resistance 3 weeks ago). You enter short with a stop 3 pips above the high. You target the next support level at 1.0850.
Why this works: You combined the pattern with a key level. The tweezer confirmed the rejection at resistance. Your risk was defined. Your target was logical.
The One Mistake 90% of Beginners Make
They trade the tweezer pattern without context.
A tweezer top in the middle of a range? Ignore it. A tweezer bottom during a strong downtrend with no support nearby? Probable false signal.
The pattern is strongest when:
- It forms at a clear support or resistance level (like a previous swing high/low)
- The wicks (shadows) are at least 2x the body length
- The overall trend has been moving for at least 10-15 candles in the current direction
Without these conditions, the success rate drops significantly.
FAQ
Is a tweezer bottom bullish or bearish?
A tweezer bottom is a bullish reversal pattern. It forms at the end of a downtrend and signals that sellers can't push price lower. Buyers are taking control.

How do I identify a tweezer top on a chart?
Look for two consecutive candles with nearly identical highs (within 1-2 pips). The first candle is usually bullish, the second bearish. The pattern works best on 4-hour or daily timeframes.
What's the difference between a tweezer and a double top?
A double top is a longer-term reversal pattern that forms over weeks or months. A tweezer top is a short-term pattern that forms over 2 candles. The tweezer often signals the start of a double top.
Can I trade tweezer patterns on any timeframe?
Technically yes, but they're most reliable on 4-hour and daily charts. On lower timeframes (1-minute, 5-minute), noise creates frequent false signals.
📝 Quick Recap
- A tweezer top and bottom pattern is a 2-candle reversal signal with matching highs (top) or lows (bottom)
- The psychology: buyers (or sellers) tried twice to break a level and failed both times
- Trade only at key support/resistance levels on 4H or daily charts
- Stop loss: 2-3 pips beyond the tweezer's high/low
- Target: next support/resistance level, or 1.5-2x your risk
- Combine with other indicators (RSI, MACD) for higher probability setups
⚡ Quick Win
Open your chart right now. Pull up EUR/USD on the 4-hour timeframe. Scroll back through the last 2 weeks. Find any pair of candles where the highs (or lows) are within 2 pips of each other. Mark them. Check if they formed at a support or resistance level. If they did — you just found a high-probability reversal zone for your next trade.


