
Why Most Traders Ignore Trade Balance — And Why That's a Mistake
You've probably seen trade balance data released in the economic calendar. Maybe you glanced at it, saw a number like "-$65 billion," and moved on to look at your charts instead. Most retail traders do exactly that.
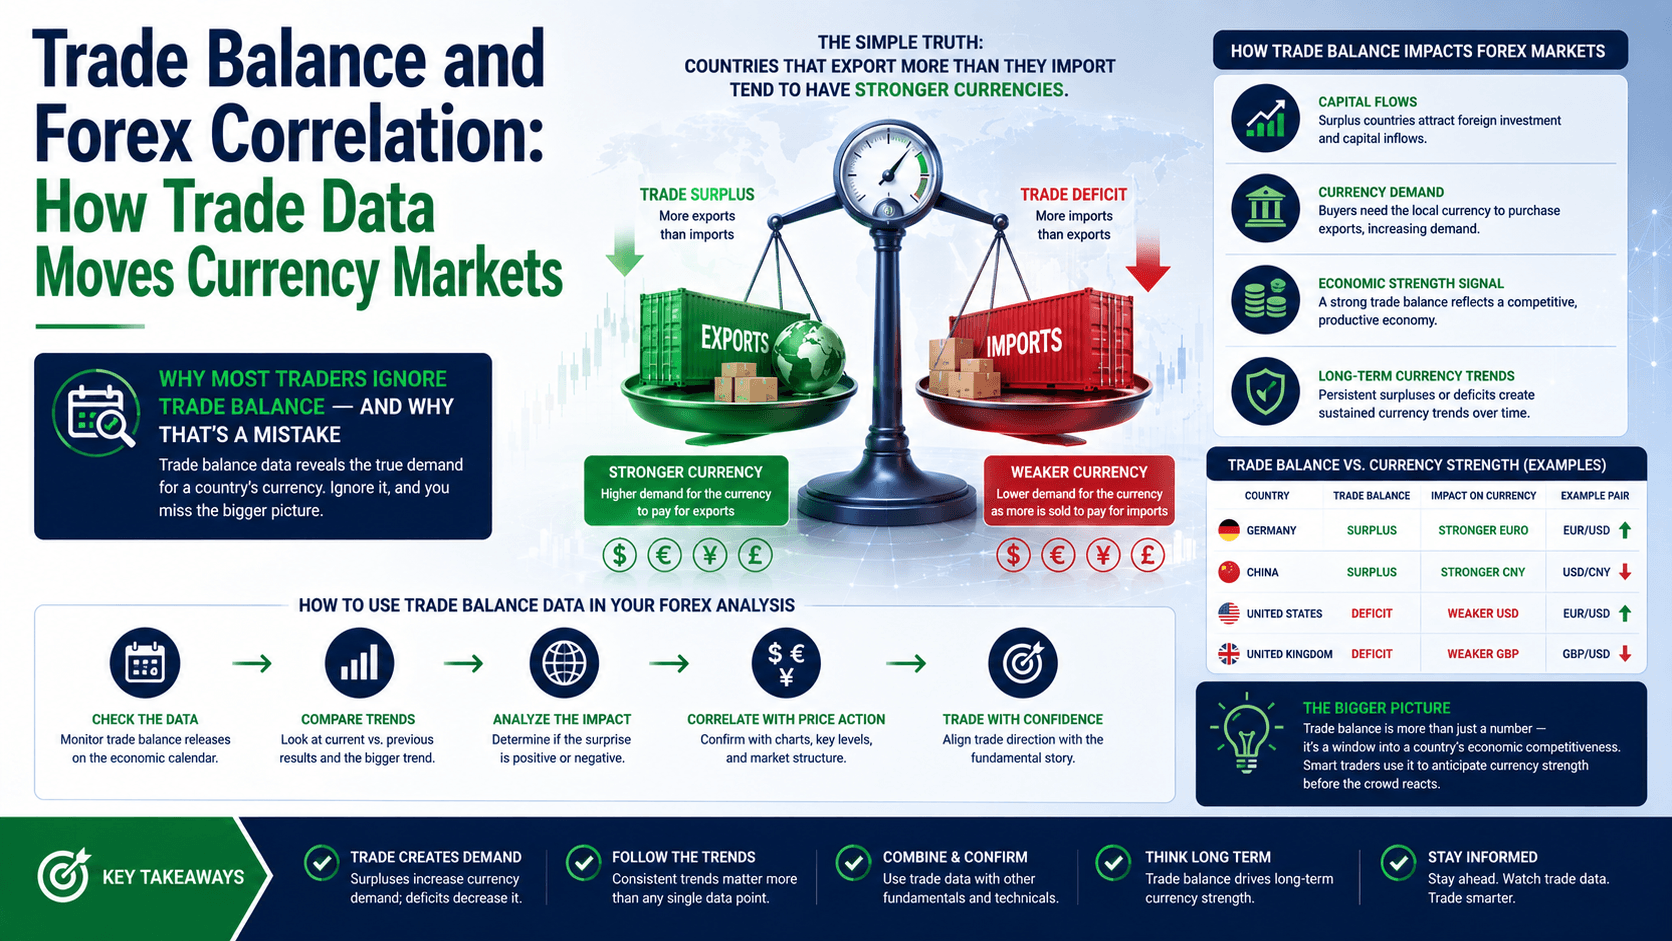
Here's what you're missing: trade balance is one of the most direct fundamental drivers of currency value. It's not complicated theory — it's simple supply and demand for money itself.
When a country exports more than it imports (trade surplus), foreign buyers need that country's currency to pay for goods. That creates demand, and the currency tends to strengthen. When a country imports more than it exports (trade deficit), it needs to sell its own currency to buy foreign goods. That increases supply, and the currency tends to weaken.
This isn't abstract. It's happening right now, every single day, in the $7.5 trillion daily forex market. And understanding this relationship gives you an edge that most technical-only traders simply don't have.
The Mechanism: How Trade Balance Drives Currency Correlation
Let's break down the actual mechanism with a concrete example.
Scenario: Japan reports a trade surplus of ¥800 billion for the month. Japanese companies sold more cars, electronics, and machinery abroad than they imported. Foreign buyers — American, European, Australian — all need yen to pay for those Japanese goods.
They go to the forex market and buy yen. They sell their own currencies to do it. This increased demand for JPY pushes USD/JPY lower (remember, USD/JPY is priced as "how many yen per dollar" — when yen strengthens, the pair drops).
Real numbers: Let's say USD/JPY is trading at 150.00 when the trade surplus data is released. The surplus is larger than expected. Institutional buyers start purchasing yen. Within an hour, USD/JPY drops to 148.50. That's 150 pips.
On a standard 0.1 lot position (10,000 units), that's approximately $67 in profit per 100 pips. On a 0.5 lot position, that's approximately $335 per 100 pips.
Now reverse it. If Japan reports a trade deficit — they imported more than they exported — Japanese companies need to sell yen to buy foreign currencies to pay for those imports. USD/JPY rallies.
The Wrong Way vs. The Right Way
The Wrong Way: Most beginners see a trade surplus number and immediately buy the currency, expecting it to strengthen. They don't consider that the market may have already priced in the data. The actual release matches expectations, and the currency doesn't move — or worse, it reverses because traders "sell the news."
Example: Australia reports a trade surplus of A$12 billion. The market expected A$11.5 billion. A beginner buys AUD/USD at 0.6500. But the surplus was only marginally above expectations, and risk sentiment suddenly turns negative. AUD/USD drops to 0.6470. The beginner loses 30 pips — $30 on 0.1 lots — because they didn't understand the context.
The Right Way: Professional traders look at three things:
- The actual vs. expected number — A big surprise moves markets more than a small one
- The trend — Is the trade balance improving or deteriorating over months?
- The broader context — What else is happening? Interest rates? Risk sentiment?
Example: New Zealand reports a trade deficit of NZ$1.5 billion, much worse than the expected NZ$800 million deficit. The deficit is also growing month-over-month. A professional trader sees this and considers shorting NZD/USD. They wait for a technical confirmation — maybe a break below a support level — before entering. They set a stop loss 30 pips above entry. They're not trading the news; they're trading the trend.
Trade Balance Correlation by Country
Not all trade balances affect currencies equally. Here's how it works for major economies:

| Country | Typical Trade Balance | Primary Correlation with Currency |
|---|---|---|
| Japan | Surplus (historically) | Strong positive — surplus tends to strengthen JPY |
| China | Large surplus | Moderate — CNY is managed, but surplus supports long-term strength |
| United States | Persistent deficit | Weak negative — deficit is structural, USD driven more by capital flows |
| Germany | Large surplus | Positive — surplus supports EUR, but EUR is shared across Eurozone |
| Australia | Surplus (commodity-driven) | Strong positive — surplus correlates with AUD strength |
| Canada | Surplus (oil-driven) | Positive — surplus linked to oil prices and CAD |
Notice the United States. Despite running massive trade deficits for decades, the USD remains strong. Why? Because capital flows — foreign investment in U.S. stocks, bonds, and real estate — more than offset the trade deficit. This is the critical nuance most beginners miss.
Trade Balance vs. Other Fundamental Drivers
Trade balance doesn't operate in isolation. It interacts with other factors:
| Factor | How It Interacts with Trade Balance |
|---|---|
| Interest rates | Higher rates attract capital, which can strengthen currency even with a trade deficit |
| Risk sentiment | In risk-off environments, safe-haven currencies (USD, JPY, CHF) can strengthen regardless of trade data |
| Commodity prices | For commodity exporters (AUD, CAD, NOK), trade balance is heavily influenced by commodity prices |
| Central bank policy | Central banks may intervene to weaken a currency even if trade surplus is growing |
This is why you can't just look at trade balance in isolation. You need to understand the full picture.
A Real-World Example: The Candy Bar Economy
Let's use a simple analogy that makes this crystal clear.
Imagine two countries: Sweetland and Savoryland. Sweetland makes candy bars. Savoryland makes potato chips.
Sweetland exports 100 candy bars to Savoryland at $1 each. Savoryland exports 50 bags of chips to Sweetland at $1 each.
Sweetland has a trade surplus of $50. Savoryland has a trade deficit of $50.
To pay for the candy bars, Savoryland needs $100 worth of Sweetland's currency. To pay for the chips, Sweetland only needs $50 worth of Savoryland's currency.
Result: More demand for Sweetland's currency than Savoryland's. Sweetland's currency appreciates. Savoryland's depreciates.
Now, Savoryland's chips become cheaper for Sweetland buyers (because their currency is stronger). Sweetland's candy bars become more expensive for Savoryland buyers. Over time, trade rebalances.
This is the mechanism in its purest form. In reality, currencies are influenced by many factors simultaneously, but the core logic remains the same.
Common Trap: The "Surplus Always Strengthens" Fallacy
The most dangerous assumption new traders make is that a trade surplus always leads to currency strength. It doesn't. Here's why:
- Market expectations: If a surplus is already priced in, the currency may not move — or may even fall if the surplus is smaller than expected
- Capital flows dominate: For countries like the U.S., capital inflows from foreign investment can overwhelm trade deficit effects
- Central bank intervention: Japan has historically intervened to weaken the yen even during trade surpluses, to support exporters
- Lag effects: Trade balance data is backward-looking. Currency markets are forward-looking. The data may reflect conditions that have already changed
The fix: Use trade balance as one piece of your analysis, not the only piece. Combine it with interest rate trends, risk sentiment, and technical levels.
How to Use Trade Balance in Your Trading
Here's a practical framework you can apply today:

- Check the economic calendar for trade balance releases from major economies (Japan, China, Germany, Australia, Canada, U.S.)
- Note the expected number and compare it to the previous month's actual
- When the data releases, compare actual vs. expected:
- Big positive surprise → potential currency strength
- Big negative surprise → potential currency weakness
- In line with expectations → likely muted reaction
- Wait 15-30 minutes for the initial volatility to settle. Don't trade the first spike — it often reverses
- Look for technical confirmation — a breakout or rejection at a key level — before entering
- Set your stop loss based on technical levels, not just the news
Example trade: Australia's trade balance is due at 11:30 AM Sydney time. The expected surplus is A$10 billion, up from A$9.5 billion last month. You're watching AUD/USD, which is trading at 0.6550.
The actual surplus comes in at A$12.5 billion — a big beat. AUD/USD jumps to 0.6575 in the first 5 minutes. You wait. It pulls back to 0.6565 and holds above the pre-release level. You enter long at 0.6565 with a stop at 0.6535 (30 pips) and a target at 0.6625 (60 pips). Risk:reward = 1:2.
On 0.1 lots, your risk is $30, and your potential profit is $60. That's a disciplined trade based on fundamental and technical confluence.
FAQ
Does a trade surplus always strengthen a currency?
No. Market expectations, capital flows, and central bank intervention can override the trade balance effect. A surplus that's smaller than expected can even weaken the currency.
Why is the U.S. dollar strong despite a massive trade deficit?
Because capital inflows — foreign investment in U.S. assets like stocks and bonds — more than offset the trade deficit. The U.S. dollar is the world's reserve currency, which creates constant demand.
How often is trade balance data released?
Monthly, typically 3-6 weeks after the end of the reporting month. The exact schedule varies by country. Check your economic calendar for specific dates.
Which currency pairs are most affected by trade balance data?
Pairs involving commodity currencies (AUD/USD, USD/CAD, NZD/USD) and the Japanese yen (USD/JPY) tend to show the strongest reactions. EUR/USD is less directly affected because the euro is shared across multiple economies.
Quick Recap
- Trade surplus = more demand for currency → potential appreciation
- Trade deficit = more supply of currency → potential depreciation
- Market expectations matter more than the raw number
- Capital flows can override trade balance effects (especially for USD)
- Combine trade balance data with technical analysis for better entries
- Always use proper risk management — 1-2% risk per trade maximum
Quick Win
Open your economic calendar right now. Find the next trade balance release for Australia, Japan, or Canada. Note the expected number and the previous month's actual. Set an alert for the release time. When it comes out, compare actual vs. expected. Then look at the affected currency pair on a 15-minute chart. Watch how it reacts. Don't trade it — just observe. Do this for three releases. You'll start seeing the pattern.


