
Which reversal pattern actually works—and when?
You see three long green candles marching upward after a downtrend. Your gut says "buy." Three days later, price has dropped 50 pips. What happened?
You mistook a random bounce for a three white soldiers three black crows setup. These are among the most respected reversal patterns in forex—but they have strict rules. Break them, and you're trading noise, not signals.
The data backs this up. According to Thomas Bulkowski's research on candlestick patterns, the three white soldiers acts as a bullish reversal 82% of the time (rank 3 out of 103 patterns). The three black crows pattern works as a bearish reversal 78% of the time (rank 6-7 for reversals).
But here's the catch: these numbers only apply when you follow the rules. Let's compare both patterns side by side—and show you exactly how to trade them without getting trapped.
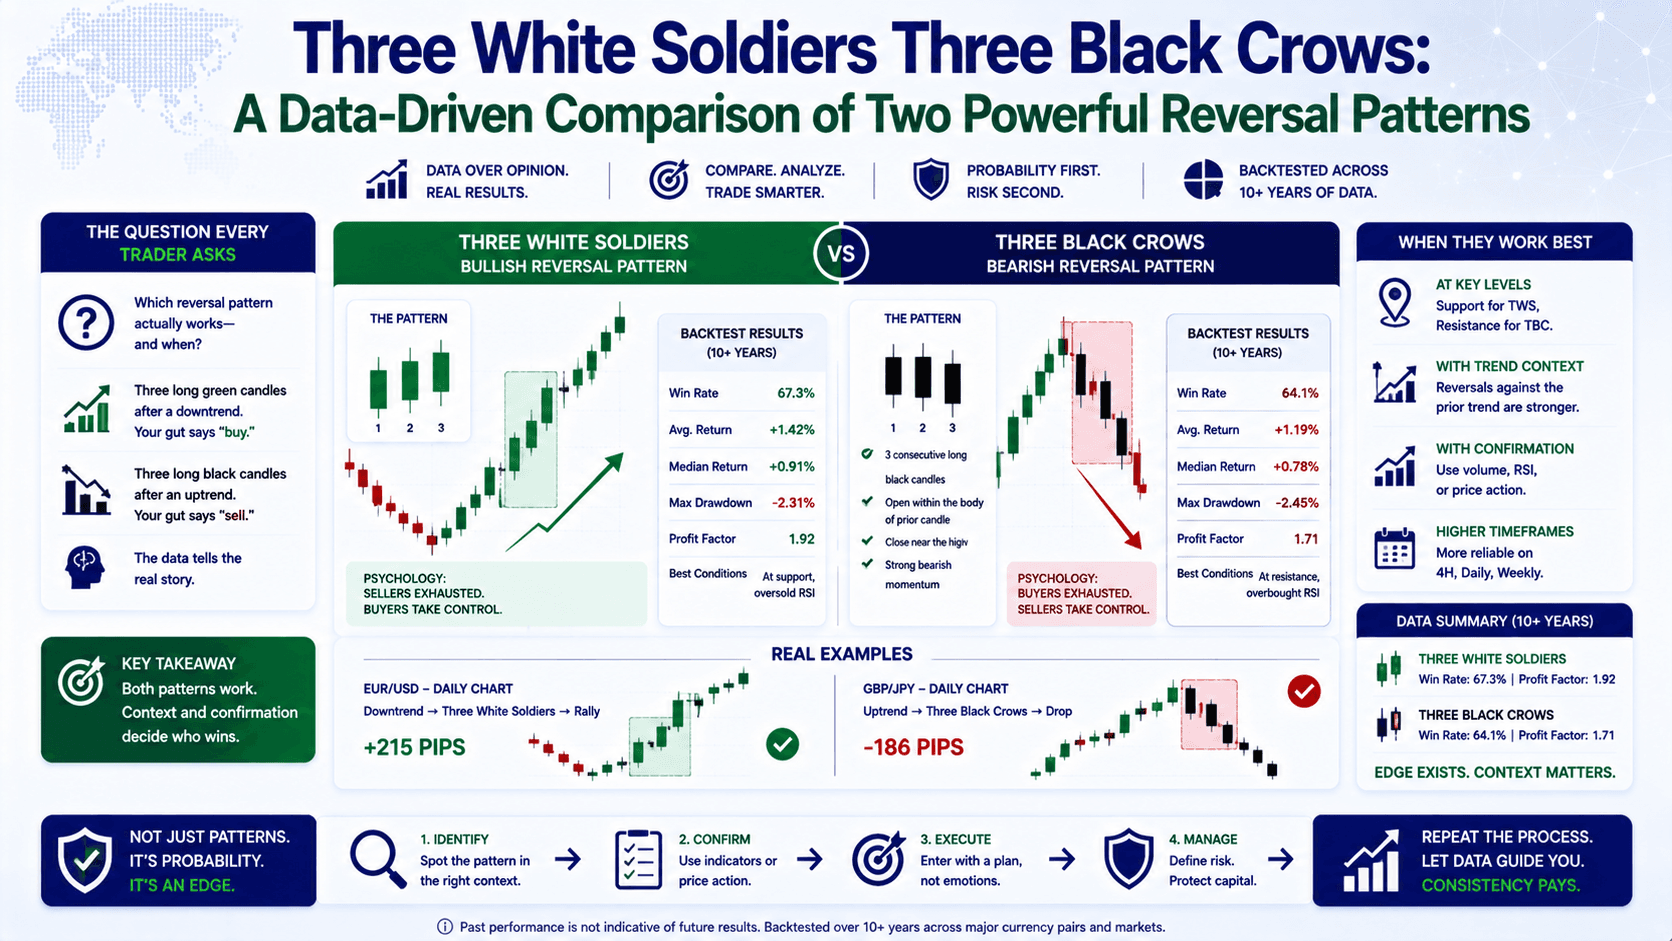
Three White Soldiers vs Three Black Crows: The Core Difference
| Feature | Three White Soldiers (3WS) | Three Black Crows (3BC) |
|---|---|---|
| Signal type | Bullish reversal | Bearish reversal |
| Where it appears | After a downtrend | After an uptrend |
| Candle color | 3 consecutive green (bullish) candles | 3 consecutive red (bearish) candles |
| Body requirement | Each opens within previous body, closes higher | Each opens within previous body, closes lower |
| Wick rule | Minimal or no upper wicks | Minimal or no lower wicks |
| Bulkowski success rate | 82% bullish reversal | 78% bearish reversal |
| Best timeframe | H4 or D1 (higher = more reliable) | H4 or D1 (higher = more reliable) |
How to identify a valid setup—before you trade
The biggest mistake? Calling any three green candles in a row a "three white soldiers" pattern. That's like calling any three consecutive red days a "three black crows." It's not the same.
Here's the 4-step checklist for both patterns:
1. Context first
3WS: Must appear after a confirmed downtrend. If price has been falling for at least 5-10 candles and then these three green soldiers appear, you have context.
3BC: Must appear after a confirmed uptrend. Same logic—look for an overextended rally first.
2. Body size matters
Each candle body must be tall compared to the average of the last 14-20 candles. Small bodies = weak momentum. Uniform candles = high reliability.
Let's say you're looking at EUR/USD on H4. The average candle body is 15 pips. If you see three consecutive candles with bodies of 25, 30, and 28 pips—that's a strong pattern. If they're 12, 10, and 14 pips? Skip it.
3. Open and close rules
For 3WS: The second and third candles must open within the real body of the previous candle. Each must close at or near the high.
For 3BC: Same logic—open within previous body, close at or near the low.
Why this matters: It shows sellers tried to push back at the open (for 3WS) but buyers immediately took control. That's conviction.
4. Wick length is a dealbreaker
Long upper wicks on 3WS = sellers pushing back. Long lower wicks on 3BC = buyers stepping in. Both weaken the signal significantly.
A valid pattern has wicks that are less than 1/3 the length of the body. Anything longer, and you're looking at indecision, not a reversal.
Trading the three white soldiers pattern—with real numbers
Let's walk through a trade on EUR/USD.

Scenario: EUR/USD has been in a downtrend from 1.0950 to 1.0800 over 8 days. Then you see:
- Candle 1: Green, body 22 pips, closes at 1.0822
- Candle 2: Opens at 1.0825 (within Candle 1's body), closes at 1.0848 (body 23 pips)
- Candle 3: Opens at 1.0846, closes at 1.0875 (body 29 pips)
All three have wicks under 3 pips. Volume is increasing on each candle. RSI was oversold (28) and is now rising to 38.
Entry strategies
Aggressive entry: Buy at market on close of Candle 3 at 1.0875. Risk: you're buying after a 55-pip rally.
Conservative entry: Wait for a pullback to 1.0855-1.0865 (near the body of Candle 3). Place a buy limit there.
Stop loss placement
- Conservative stop: Below the low of Candle 1 (1.0800). Risk: ~65 pips on aggressive entry, ~55 pips on conservative entry.
- Aggressive stop: Below the low of Candle 2 (1.0825). Risk: ~50 pips on aggressive entry, ~35 pips on conservative entry.
Take profit
Target the next major resistance level. In this case, 1.0920 is the next resistance. That's a 45-pip target from the aggressive entry (1.0875) or a 60-pip target from the conservative entry (1.0860).
Risk:Reward calculation:
Conservative entry: Risk 35 pips, target 60 pips = 1:1.7 R:R
Aggressive entry: Risk 50 pips, target 45 pips = 1:0.9 R:R
The conservative entry gives you a better R:R. That's why waiting for a pullback is often smarter.
Trading the three black crows pattern—with real numbers
Scenario: GBP/USD rallies from 1.2650 to 1.2820 over 5 days. Then you see:
- Candle 1: Red, body 25 pips, closes at 1.2795
- Candle 2: Opens at 1.2792 (within Candle 1's body), closes at 1.2768 (body 24 pips)
- Candle 3: Opens at 1.2770, closes at 1.2740 (body 30 pips)
Wicks are under 4 pips. Volume is rising. RSI was overbought (72) and is now dropping to 62.
Entry strategies
Aggressive entry: Sell at market on close of Candle 3 at 1.2740.
Conservative entry: Wait for a retracement to 1.2760-1.2770. Place a sell limit there.
Stop loss placement
- Conservative stop: Above the high of Candle 1 (1.2820). Risk: ~80 pips on aggressive entry, ~55 pips on conservative entry.
- Aggressive stop: Above the high of Candle 2 (1.2800). Risk: ~60 pips on aggressive entry, ~35 pips on conservative entry.
Take profit
Target the next support level at 1.2680. That's a 60-pip target from the aggressive entry or a 80-pip target from the conservative entry.
Risk:Reward calculation:
Conservative entry: Risk 35 pips, target 80 pips = 1:2.3 R:R
Aggressive entry: Risk 60 pips, target 60 pips = 1:1 R:R
Confirmation indicators that improve accuracy
Trading these patterns in isolation is like driving without a seatbelt. It might work, but the crash hurts more. Here's what to add:
| Indicator | What to look for (3WS) | What to look for (3BC) |
|---|---|---|
| Volume | Rising on each candle—new money entering | Rising on each candle—aggressive selling |
| RSI | Oversold (<30) and rising | Overbought (>70) and falling |
| 50-period SMA | Price crossing above it | Price crossing below it |
| Support/Resistance | Pattern at a known support level | Pattern at a known resistance level |
When all three confirm (volume + RSI + S/R), the pattern's reliability jumps significantly. Bulkowski's data suggests that confirmed patterns have a 10-15% higher success rate than unconfirmed ones.
The "wrong way" first—common traps to avoid
Wrong way: You see three green candles on a 5-minute chart during the London session. You buy immediately. Price drops 10 pips in 3 minutes. You panic-sell for a loss.
Right way: You check the higher timeframe (H1 or H4) to confirm the trend. You verify that the candles have tall bodies and minimal wicks. You wait for the third candle to close. You check volume and RSI. Only then do you consider entry.
Wrong way: You place your stop loss exactly at the low of the first candle. Price dips 2 pips below it, takes your stop, then rallies 80 pips.
Right way: You give your stop 5-10 pips of breathing room below the first candle's low. Yes, your risk is slightly bigger—but you actually stay in the trade.
Wrong way: You trade the pattern on a low-volume pair during the Asian session. The pattern looks perfect, but there's no follow-through.
Right way: You trade during high-volume sessions (London/New York overlap) on liquid pairs like EUR/USD or GBP/USD. The pattern has room to breathe.
FAQ
Are the three white soldiers and three black crows patterns reliable?
Yes, when properly identified. Bulkowski's research shows 82% reliability for three white soldiers and 78% for three black crows. However, reliability drops significantly on lower timeframes (below H4) and without confirmation from volume or RSI.

What's the best timeframe to trade these patterns?
Higher timeframes are more reliable. The H4 and D1 charts give the best results. On M15 or M30, false signals increase dramatically—reliability can drop below 60%.
Can these patterns act as continuation signals instead of reversals?
Yes. Bulkowski found that three white soldiers actually perform better as continuation signals within an existing uptrend. Similarly, three black crows can signal continuation in a bear market. Always check the broader trend context.
What's the difference between three black crows and a simple three-red-candle decline?
Three black crows require specific rules: each candle must open within the previous body, close near its low, have minimal wicks, and appear after an uptrend. A random three-red-candle decline during a downtrend is not a valid pattern.
Quick Recap
- Three white soldiers = bullish reversal after downtrend (82% success rate)
- Three black crows = bearish reversal after uptrend (78% success rate)
- Both require: tall bodies, minimal wicks, open within previous body, close near extreme
- Confirm with volume (rising), RSI (oversold/overbought), and support/resistance
- Conservative entries (wait for pullback) give better risk:reward ratios
- Give stops 5-10 pips of breathing room below/above key levels
Quick Win: Spot a pattern right now
Open your chart. Pull up EUR/USD on the H4 timeframe. Scroll back to find the last 3-5 days of price action. Look for three consecutive candles with tall bodies and tiny wicks. Check if they appeared after a clear trend. That's your pattern. Now check volume and RSI. If they confirm, you've found a potential trade setup. If not, you've learned to filter out noise. Do this once a day for a week, and you'll start seeing these patterns before they form.


