
Let's Settle This Once and For All
You've probably heard the debate a hundred times. On one side, the chart guys — staring at lines and candles like they're reading tea leaves. On the other, the news guys — refreshing economic calendars and central bank speeches like their life depends on it.
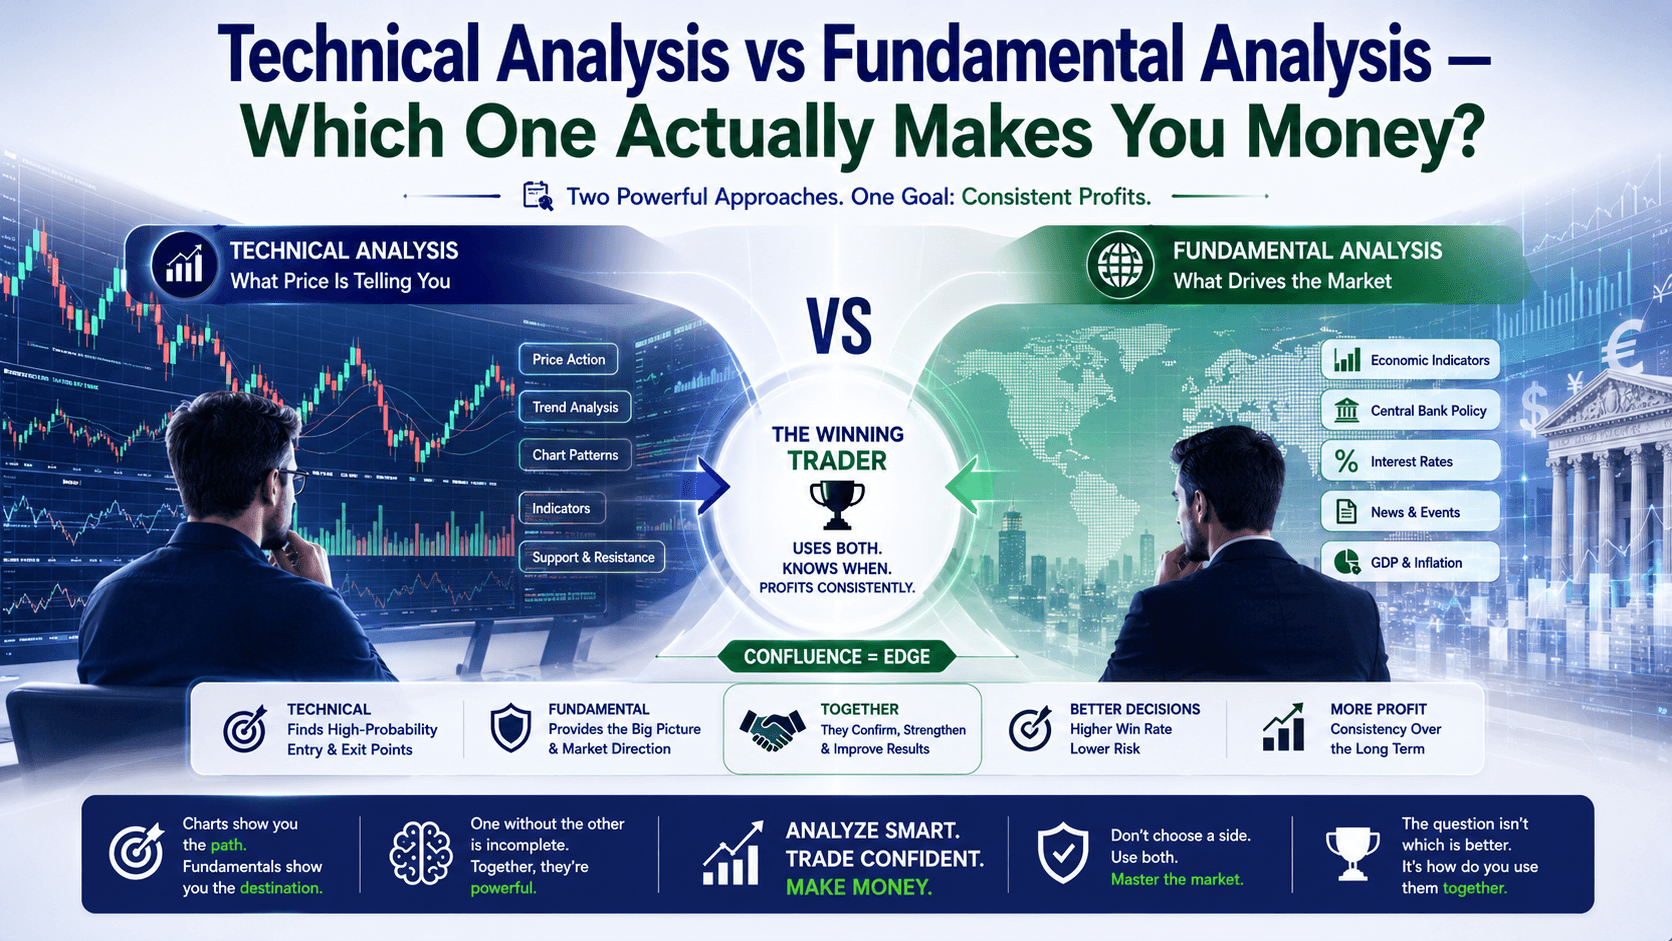
And then there's you, stuck in the middle, wondering: technical analysis vs fundamental analysis — which one should I actually use?
Here's the short answer: Both. But not in the way you think.
Let me show you exactly how each one works, where they fail, and how to combine them so you stop guessing and start trading with actual data.
What Is Technical Analysis? (The Chart Reader's Approach)
Technical analysis is the study of price movement itself. You look at historical price data — candlesticks, trends, support and resistance — and use that to predict where price goes next.
The core belief? Price discounts everything. All the news, all the fundamentals, all the sentiment — it's already baked into the chart.
How It Works in Practice
Let's say EUR/USD is trading at 1.0850. You see a hammer candle form at a key support level around 1.0830. The wick is long, the body is small — rejection. You go long at 1.0852 with a stop at 1.0835 (17 pips). Target: 1.0880 (28 pips).
Risk:reward = 1:1.6. On 0.1 lots, that's $17 risk for $28 potential profit.
You're not asking why the market is at 1.0850. You're just trading the pattern.
Key Tools in Technical Analysis
- Candlestick patterns — hammers, engulfing, dojis
- Support and resistance — the lines that matter
- Moving averages — 50 EMA, 200 EMA
- RSI, MACD, Bollinger Bands — momentum and volatility
- Chart patterns — head and shoulders, flags, triangles
When Technical Analysis Shines
Short-term trading. Scalping, day trading, swing trading. If you're in and out within hours or days, technical analysis gives you specific entry and exit points. You know exactly where to get in and where to get out.
Where It Fails
It ignores why the market moves. A surprise interest rate hike can blow through every support level like they don't exist.
I've seen traders lose 50 pips in 10 minutes because they didn't know the Fed was speaking. Their charts looked perfect — until they didn't.
What Is Fundamental Analysis? (The Economist's Approach)
Fundamental analysis looks at the underlying value of a currency or asset. For forex, that means economic data, central bank policy, GDP, inflation, employment numbers — the big picture stuff.

The core belief? Price follows value. If a currency is undervalued based on economic data, it will eventually rise. If it's overvalued, it will fall.
How It Works in Practice
Let's say the US releases a strong Non-Farm Payrolls report — 300,000 jobs added vs 200,000 expected. Unemployment drops. Wages rise.
A fundamental trader thinks: "Strong economy = Fed keeps rates higher = USD strengthens."
They go long USD/JPY at 150.50, targeting 152.00. Stop at 149.80. Risk: 70 pips. Reward: 150 pips. Risk:reward = 1:2.1.
On 0.1 lots, that's $70 risk for $150 potential profit.
Key Tools in Fundamental Analysis
- Economic indicators — GDP, CPI, NFP, retail sales
- Central bank policy — interest rates, forward guidance
- Geopolitical events — elections, trade wars, conflicts
- Market sentiment — risk-on vs risk-off
When Fundamental Analysis Shines
Long-term positioning. If you're holding trades for weeks or months, fundamentals tell you the direction of the trend. You know whether to be long or short based on economic reality.
Where It Fails
Timing. You can be right about the direction but wrong about the entry. The market can stay irrational longer than you can stay solvent.
A classic example: EUR/USD was fundamentally weak in 2022 (high inflation, energy crisis) but kept bouncing off support levels. Pure fundamental traders got stopped out repeatedly before the big move down.
Technical Analysis vs Fundamental Analysis — Head to Head
| Criterion | Technical Analysis | Fundamental Analysis |
|---|---|---|
| Time horizon | Short-term (minutes to days) | Long-term (weeks to months) |
| Focus | Price charts, patterns, indicators | Economic data, central bank policy |
| Entry/exit precision | High — you know exact levels | Low — you know direction, not timing |
| Data source | Historical price data | Economic reports, news |
| Best for | Scalpers, day traders, swing traders | Position traders, investors |
| Key risk | News events can break patterns | Poor timing — early entries |
| Success rate (typical) | 50-60% with good risk management | 60-70% on direction, but timing is harder |
The Wrong Way vs The Right Way
The Wrong Way: Picking a Side
Most beginners choose one camp. They either stare at charts all day and get blindsided by a rate decision, or they read news all day and miss the actual entry because they're waiting for "confirmation."
Result? Inconsistent results and blown accounts.
The Right Way: Combine Both
Here's the framework I teach at TheNextTrade Academy:
Step 1: Use fundamentals for direction. Check the economic calendar. Is the Fed hawkish or dovish? Is inflation rising or falling? That tells you whether to be long or short on the higher timeframe.
Step 2: Use technicals for timing. Once you know the direction, wait for a technical setup — a support bounce, a trendline break, a candlestick pattern — to enter.
Let me show you with a real example:
It's Tuesday morning. You check the calendar and see the ECB interest rate decision is coming Thursday. The market expects a 25 bps hike. You think EUR/USD will rise.
Direction: Long EUR/USD.
Now you pull up the 1-hour chart. EUR/USD is at 1.0850. You see a bullish engulfing candle at a support level of 1.0830. You enter at 1.0852 with a stop at 1.0835 (17 pips). Target: 1.0880 (28 pips).
Fundamentals gave you the why. Technicals gave you the when and where.
Why the "Pure" Approaches Fail
Here's what nobody tells you:
Pure technical analysis ignores the fact that central banks can change everything in 30 seconds. A surprise rate cut can wipe out a month of support levels.
Pure fundamental analysis ignores the fact that price moves in waves. You can be right about the direction but lose money because your entry was terrible.
The data backs this up. A study by J.P. Morgan found that traders who combined both approaches had a 30% higher risk-adjusted return than those who used only one. The reason? They reduced the blind spots.
FAQ
Is technical analysis or fundamental analysis better for beginners?
Start with technical analysis. It's easier to learn and gives you immediate feedback. You can see support and resistance on a chart in 5 minutes. Fundamentals take months to understand properly.

Can I trade forex using only technical analysis?
Yes — many professional traders do. But you need to be aware of major news events. Check the economic calendar before every trade. One rate decision can destroy your setup.
How do I combine technical and fundamental analysis?
Use fundamentals for direction (long or short) and technicals for timing (entry and exit). It's the most powerful combination. Fundamentals tell you what to trade; technicals tell you when.
Do professional traders use both?
Most do. A survey of institutional forex traders found that 78% use both technical and fundamental analysis. The ones who pick one side are usually retail traders who haven't learned the other yet.
📝 Quick Recap
- Technical analysis = price charts, patterns, indicators — best for timing
- Fundamental analysis = economic data, central bank policy — best for direction
- Using only one creates blind spots. News events break charts; poor timing kills fundamentals
- The winning combination: fundamentals for direction + technicals for entry/exit
- Check the economic calendar before every trade — even if you're a pure technical trader
Your Quick Win (Do This Today)
Open your trading platform. Pull up EUR/USD on the 1-hour chart. Now open an economic calendar in another tab.
Find the next major news event for the US or Eurozone. Write down the date and time. Now look at your chart — is price near a key support or resistance level?
That's your setup. The news gives you direction. The level gives you entry. You're now trading like a professional.


