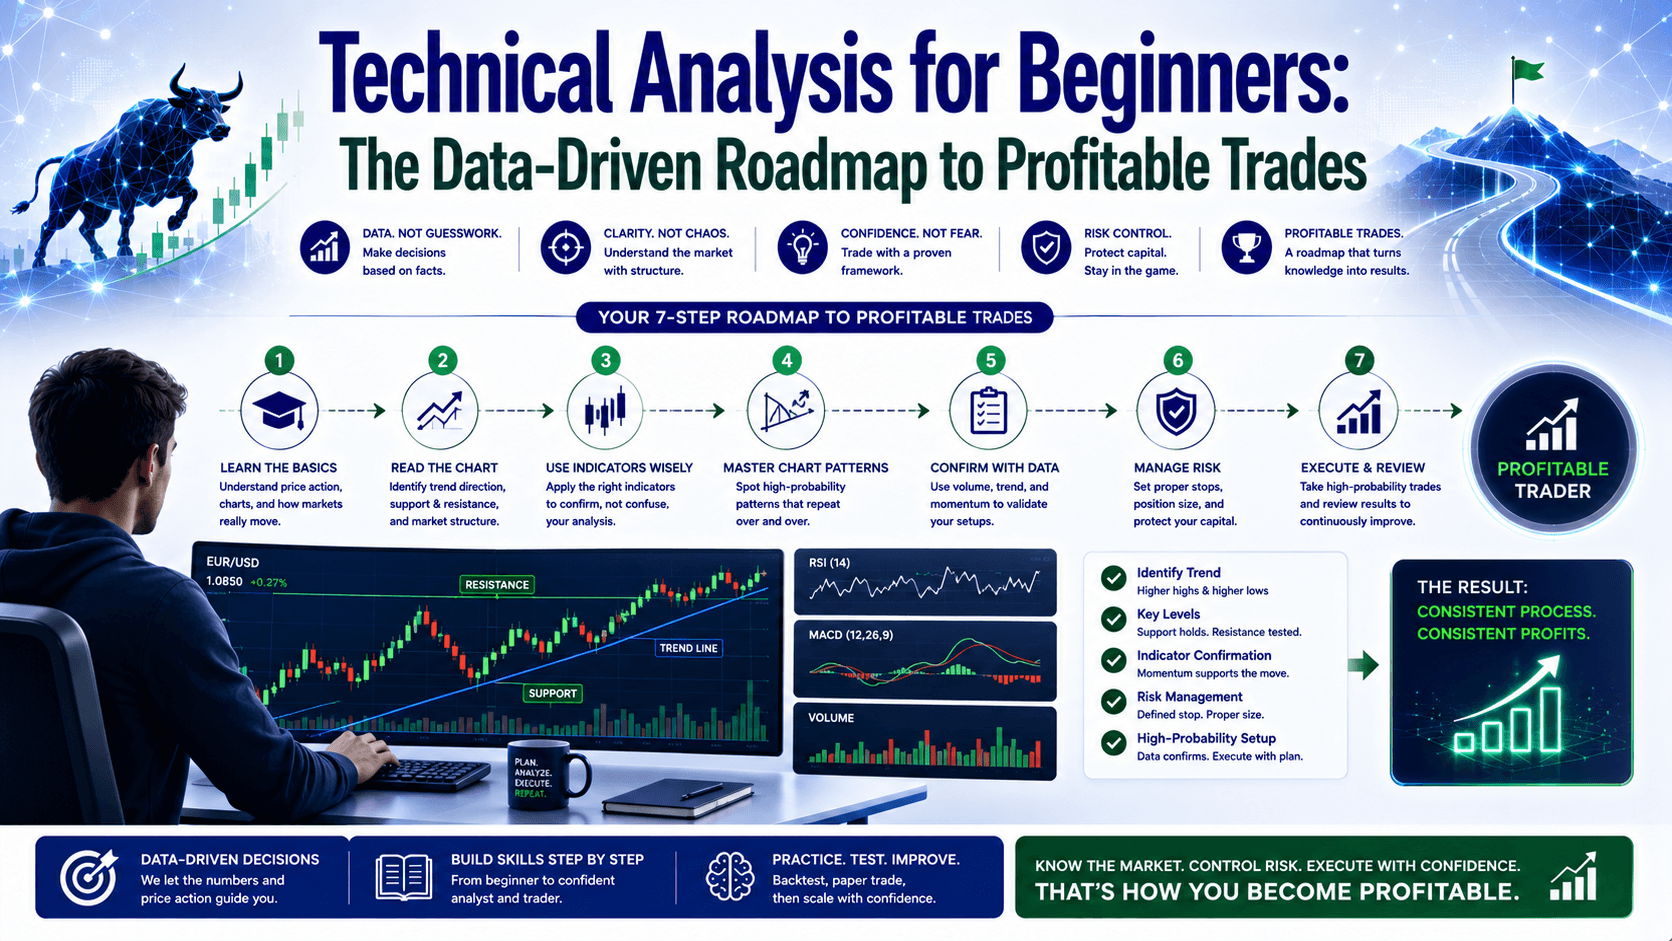

Technical Analysis for Beginners: Your Roadmap to the Market
Ever stared at a EUR/USD chart, feeling like you’re trying to read an alien language? You see lines, colors, and prices flashing, but connecting them to a profitable trade seems impossible. This isn’t a mystery novel; it’s just data waiting to be interpreted. As Captain TheNextTrade, I'm here to show you how to turn that confusing chart into a clear roadmap.
Most beginners look at charts but don't know what to *see*. They end up making emotional decisions, jumping into trades based on gut feelings, and often losing money. The fix? A structured approach. That's where technical analysis for beginners comes in. It's about understanding the raw price action and making logical, data-backed trading decisions.
Stop Guessing: Why Technical Analysis is Your Edge
Technical analysis is the study of past price movements to predict future ones. It operates on a core principle: all relevant market information is already reflected in the price. Instead of focusing on news or economic reports, technical traders zoom in on charts, looking for patterns that tend to repeat.
Why is this crucial, especially in the fast-paced forex market? Because it gives you a systematic way to react. Imagine trading without understanding how prices typically behave. You're essentially flipping a coin with your capital on the line. Technical analysis, however, equips you with tools for:
- Real-Time Decisions: Spotting patterns and signals as they form, allowing for quick, informed actions.
- Trend Identification: Aligning your trades with the market’s dominant direction, minimizing fighting the current.
- Risk Management: Pinpointing exact levels for your stop loss and take profit orders, protecting your capital from unexpected moves.
- Market Psychology: Recognizing how collective human behavior—fear, greed, optimism—shapes price movements.
On the other hand, fundamental analysis looks at economic data, news, and interest rates. Both are valid, but they serve different purposes. Here's a quick comparison:
| Feature | Technical Analysis | Fundamental Analysis |
|---|---|---|
| Focus | Historical price, volume, chart patterns | Economic data, news, interest rates |
| Primary Tools | Charts, indicators, candlestick patterns | Economic calendars, news feeds, central bank reports |
| Time Horizon | Short-term to long-term (scalping to investing) | Medium- to long-term (impact of policies) |
| Assumption | All info is in price; history repeats | Economic factors drive value |
The data suggests that for active forex traders, a strong grasp of technical analysis offers more immediate, actionable insights for daily decision-making.
The Core of Technical Analysis: Reading Price Action
Price action is the raw, unfiltered story of what buyers and sellers are doing. It's the foundation of all technical analysis. Forget complex indicators for a moment; just look at the candles. Are prices making higher highs and higher lows? That's an uptrend. Lower highs and lower lows? A downtrend. Simple, right?

Defining Your Boundaries: Support and Resistance
Support and resistance levels are like invisible walls where price tends to pause or reverse. Think of support as a floor where buyers step in, and resistance as a ceiling where sellers take over. These aren't exact lines; they're usually zones where demand or supply is strong.
Here's a common trap many beginners fall into (I did too, back in the day): they set their stop loss exactly at the support or resistance level. Let’s say EUR/USD is trading at 1.0850 and you see strong support at 1.0800. You buy at 1.0850, confident it'll bounce. Where do you put your stop?
The Wrong Way: You place your stop loss exactly at 1.0800. What happens? Price dips to 1.0797, triggers your stop, and then rockets back up to 1.0880. Sound familiar? That sting of getting stopped out by a few pips is pure loss aversion at work – and it’s preventable.
The Right Way: Give your stop loss some breathing room. Instead of 1.0800, set it at 1.0790 – 10 pips below the actual support level. Yes, your risk in dollars is slightly higher, but the data suggests you'll stay in more trades that eventually turn profitable. For a 0.1 lot trade, a 30-pip stop at 1.0820 (entry 1.0850) means $30 risk. With that extra 10 pips, your stop moves to 1.0810, increasing your risk to $40. That extra $10 can be the difference between getting shaken out and riding a winning trade.
This means your average trade might have a slightly larger risk value, but your hit rate on trades that respect support/resistance could improve, leading to better overall performance. It's about optimizing for probability, not minimizing pip-risk at all costs.
Identifying Market Direction: Trends vs. Ranges
Markets generally move in one of two ways: they trend, or they range. Understanding which one you’re in is fundamental to selecting the right strategy.
- Uptrend: Price makes consistent higher highs and higher lows. This indicates strong buying pressure. Your strategy? Look for buying opportunities on pullbacks.
- Downtrend: Price makes consistent lower highs and lower lows. Selling pressure is dominant. Your strategy? Look for selling opportunities on rallies.
- Range-Bound Market: Price moves sideways, bouncing between a clear support and resistance level. Neither buyers nor sellers are in firm control. Your strategy? Buy at support, sell at resistance, profiting from the oscillation.
The optimal approach depends entirely on identifying the prevailing market condition. Trading against the trend in a strongly trending market, for example, often results in quick losses.
Beyond the Basics: Choosing Your Chart Type
Charts are your visual data stream. Each type offers a different perspective. While line and bar charts have their uses, candlestick charts are the workhorse for most serious traders. They provide the richest visual information, capturing open, high, low, and close prices, plus market sentiment, all in one glance.
| Chart Type | Data Shown | Pros | Cons | Best For |
|---|---|---|---|---|
| Line Chart | Closing price only | Simplest, clean overview | Lacks detail (OHLC) | Identifying major trends |
| Bar Chart | Open, High, Low, Close (OHLC) | Shows price range & volatility | Can appear cluttered | Detailed price action, S&R |
| Candlestick Chart | OHLC + body color (sentiment) | Visually intuitive, rich patterns | Requires interpretation skill | All-around analysis, pattern recognition |
The data clearly points to candlestick charts as the most comprehensive choice for beginners and pros alike, despite the steeper learning curve. The immediate visual feedback on market sentiment is invaluable.
Candlestick Clues: Simple Patterns That Actually Work
Candlestick patterns are formations that offer clues about potential reversals or continuations. They're visual representations of market psychology. Let's look at two simple, high-probability patterns that are easy to spot.
The Hammer (Bullish Reversal)
Imagine EUR/USD is in a clear downtrend. Suddenly, you see a candle with a small body near the top and a long lower wick – like a hammer. This means sellers pushed price down significantly, but then buyers stepped in with strong force, pushing it back up to close near the open or even slightly higher.
The Signal: Strong buying pressure has entered the market after a sell-off, suggesting a potential bullish reversal.
Trade Example (Hammer):
- Asset: EUR/USD
- Scenario: Downtrend, EUR/USD hits strong support at 1.0810. A hammer forms with open at 1.0815, low at 1.0790, close at 1.0820.
- Entry: Buy 0.1 lots at 1.0825 (just above the hammer close, confirming upward momentum).
- Stop Loss: 1.0780 (below the hammer's low, plus a buffer).
- Target: 1.0875 (previous resistance).
- Risk (45 pips): $45.00
- Reward (50 pips): $50.00
- Risk:Reward: ~1:1.1
While the risk:reward isn't huge, the hammer's appearance at a critical support level significantly increases the probability of a bounce. This data-driven entry offers a clear reason to take the trade.
Bullish Engulfing Pattern (Strong Bullish Reversal)
This is a two-candle pattern. The first candle is a small bearish candle. The second candle is a much larger bullish candle that completely 'engulfs' the body of the first candle. This shows an overwhelming shift from selling pressure to buying pressure.
The Signal: Buyers have completely dominated sellers, often at a key support level, indicating a strong potential upward reversal.
Trade Example (Bullish Engulfing):
- Asset: EUR/USD
- Scenario: Downtrend approaching a 1.0900 support level. A small red candle forms, followed by a large green candle that opens below its close and closes above its open, fully engulfing it.
- Entry: Buy 0.1 lots at 1.0910 (after the engulfing candle closes).
- Stop Loss: 1.0870 (below the engulfing candle’s low, plus buffer).
- Target: 1.0980 (next resistance level).
- Risk (40 pips): $40.00
- Reward (70 pips): $70.00
- Risk:Reward: 1:1.75
The larger body of the engulfing candle, especially when it closes significantly higher than the previous candle, provides compelling data for a strong directional move.
FAQ
Is technical analysis reliable?
Technical analysis is not a crystal ball; it deals with probabilities, not certainties. Its reliability comes from its systematic approach and the fact that many market participants use similar methods, creating self-fulfilling patterns. Consistent application with strong risk management is key.

How long does it take to learn technical analysis?
You can grasp the basics in a few weeks, but mastery takes months to years of consistent practice and chart observation. The goal isn't just to memorize patterns, but to understand the underlying market psychology and apply it.
Can I trade with only technical analysis?
Yes, many successful traders rely solely on technical analysis, especially for short-term and medium-term trading. They believe all fundamental information is already reflected in the price. However, combining it with a basic awareness of major news events can enhance decision-making.
Quick Recap
- Technical analysis for beginners is your systematic way to read price data.
- It focuses on charts and patterns, assuming history repeats due to market psychology.
- Support and resistance are key zones, and always give your stop loss breathing room.
- Candlestick charts offer the most detailed visual information.
- Patterns like the Hammer and Bullish Engulfing provide high-probability trade signals.
Quick Win: Start Seeing, Not Just Looking
Open your trading platform right now. Pull up EUR/USD on the 1-hour timeframe. Find the last 3-5 times price formed a strong Hammer or Bullish Engulfing pattern. Notice where they occurred – often at support levels. Now, imagine where you would have placed your entry, stop loss, and target based on what you just learned. This isn't just theory; it's how you train your eyes to read the market.


