
Ever Placed a Trade That Looked Perfect — Then Price Hit Your Stop and Reversed?
You're not alone. I've been there too. The chart was perfect. EUR/USD at 1.0850, support was clear at 1.0830. You went long. Stop at 1.0820. Then price dropped to 1.0818, took your stop, and bounced to 1.0900.
That's the pain of not understanding support and resistance trading.
Most beginners think these are just lines on a chart. They're wrong. These lines represent the collective psychology of every trader in the market — and if you don't respect them, they'll cost you real money.
Let's fix that. Right now.
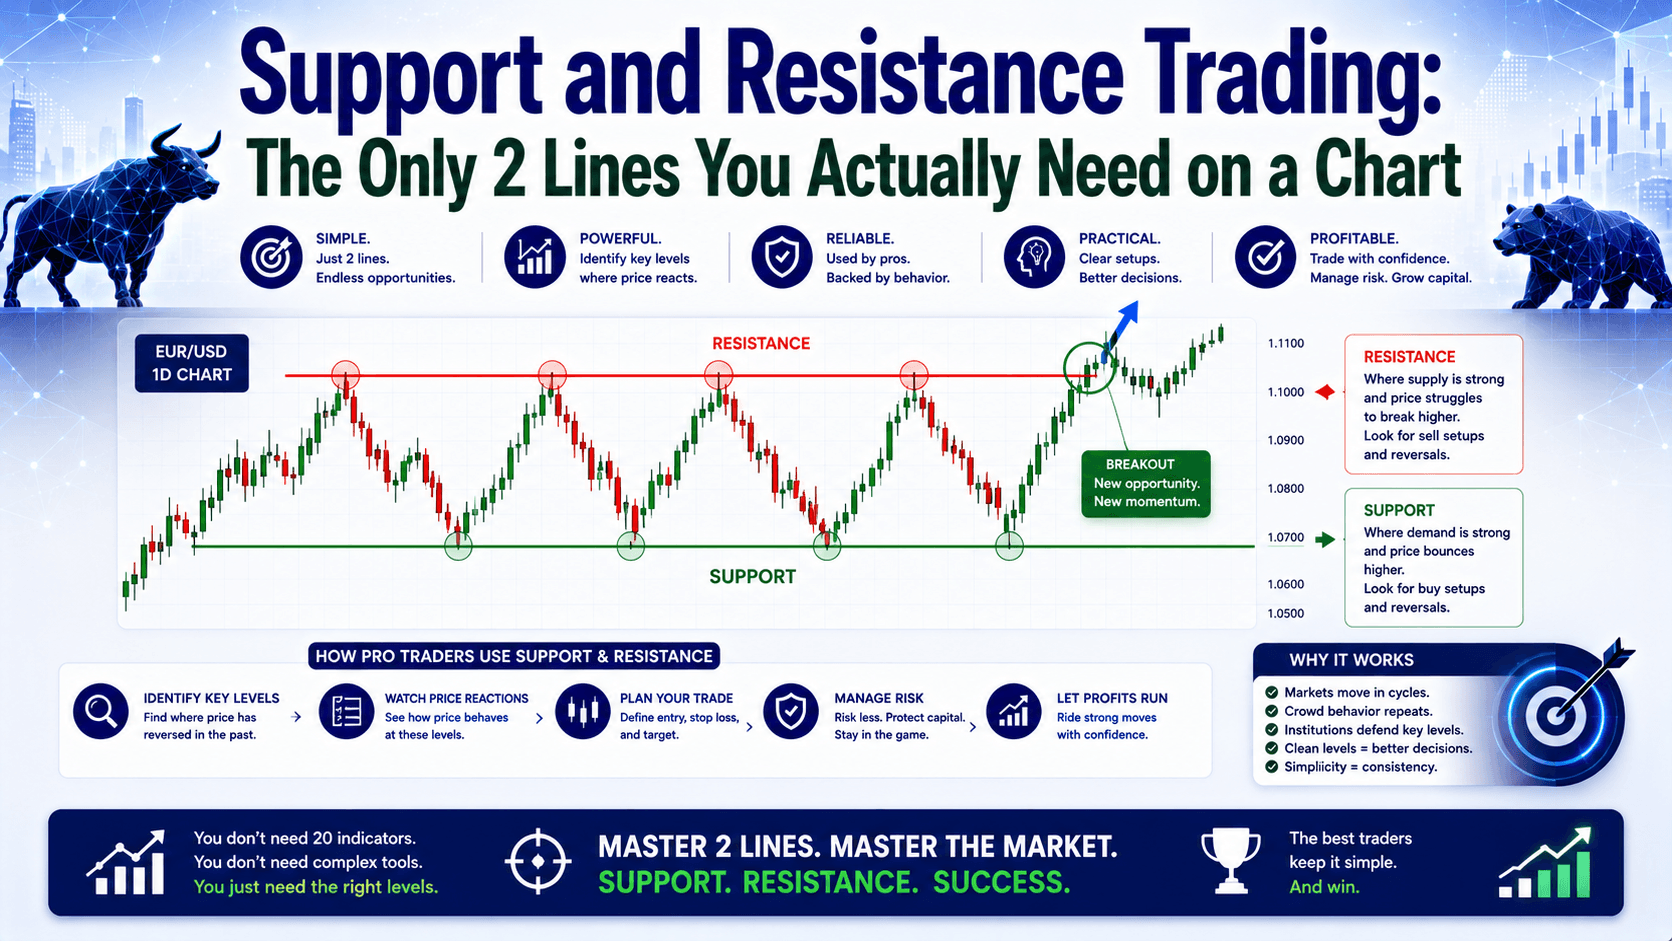
What Is Support and Resistance Trading? (The Simple Version)
Support is a price level where buying pressure is strong enough to stop a downtrend. Think of it as a floor. When price hits support, buyers step in and push it back up.
Resistance is the opposite — a ceiling where selling pressure stops an uptrend. When price hits resistance, sellers take control and push it back down.
Here's the key: these aren't exact numbers. They're zones. EUR/USD might have support between 1.0820 and 1.0830, not at exactly 1.0825.
Let's see how this plays out with real numbers.
The $80 Mistake Most Beginners Make
Let's say you're trading EUR/USD at 1.0850. You see a clear support level at 1.0800 from three previous touches. You think: "Perfect, I'll buy at 1.0850 with a stop at 1.0800."

Here's the problem: you're treating support as an exact line. Price drops to 1.0797, takes your stop, then bounces to 1.0880.
Your loss: 53 pips × $1.50/pip (0.1 lots) = $79.50.
What should you have done? Given the level 10-15 pips of breathing room. Place your stop at 1.0785 instead of 1.0800. Your risk increases slightly — from $75 to $97.50 — but you stay in the trade and catch the bounce.
That's the difference between treating support as a zone versus a line.
Two Ways to Trade Support and Resistance
There are only two strategies you need to know. Let's compare them:
| Strategy | What You Do | When It Works | Risk Level |
|---|---|---|---|
| The Bounce | Buy at support, sell at resistance | Strong trend or range-bound market | Lower |
| The Breakout | Buy when resistance breaks, sell when support breaks | Strong momentum after a breakout | Higher |
Trading the Bounce (The Safer Way)
This is where you buy when price hits support in an uptrend, or sell when price hits resistance in a downtrend.
Real example: GBP/USD is at 1.2700. Resistance is at 1.2750 (tested 3 times). You see a bearish engulfing candle at 1.2745. You go short at 1.2745, stop at 1.2770 (25 pips), target at 1.2670 (75 pips).
Risk: 25 pips × $1/pip (0.1 lots) = $25. Potential reward: 75 pips × $1/pip = $75. That's a 1:3 risk-reward ratio.
Trading the Breakout (Higher Risk, Higher Reward)
When support or resistance breaks, it often signals a major shift in market sentiment. But false breakouts are common.
The rule: Wait for price to close beyond the level, ideally with increased volume or momentum. Don't enter on the first touch.
Real example: USD/JPY is at 150.00. Resistance at 150.50 has held for weeks. Price breaks to 150.55 and closes there. You buy at 150.55, stop at 150.00 (55 pips), target at 152.00 (145 pips).
Risk: 55 pips × $0.90/pip (0.1 lots) = $49.50. Potential reward: 145 pips × $0.90/pip = $130.50. That's a 1:2.6 risk-reward ratio.
How to Identify Strong Support and Resistance Levels
Not all levels are created equal. Here's how to spot the ones worth trading:
- Multiple touches: A level tested 3+ times is stronger than one tested once.
- Round numbers: EUR/USD at 1.1000, GBP/USD at 1.3000 — these attract orders from banks and retail traders alike.
- Previous swing highs/lows: The last major high or low on your timeframe is a natural level.
- Multi-timeframe alignment: A support level on the 1-hour chart that also appears on the 4-hour chart is more reliable.
Pro tip: Use a line chart instead of a candlestick chart to plot your levels. Line charts show only closing prices, filtering out the "noise" of intraday wicks that can be misleading.
What Happens When Support Becomes Resistance (And Vice Versa)
This is one of the most powerful concepts in support and resistance trading.
When price breaks through resistance, that level often becomes new support on pullbacks. When price breaks below support, that level becomes new resistance.
Real example: Gold (XAU/USD) had resistance at $2,350 for weeks. It broke to $2,360. A week later, it pulled back to $2,348 — and bounced. The old resistance became new support.
Traders who recognized this bought the pullback at $2,350, with a stop at $2,340 (10 points), and rode the move to $2,400. That's a 1:5 risk-reward ratio.
FAQ
How do I know if a support or resistance level has truly broken?
Look for a close beyond the level, ideally with increased momentum or volume. A single wick through the level isn't a breakout — it's a test. Wait for confirmation on the next candle.

What's the best timeframe for support and resistance trading?
Higher timeframes (daily, weekly) produce stronger, more reliable levels. Lower timeframes (15-minute, 1-hour) produce more signals but more false breaks. Start with the 1-hour or 4-hour chart as a beginner.
Can I use support and resistance with other indicators?
Yes. Combining levels with RSI or MACD helps confirm reversals. For example, if price hits support and RSI shows oversold, the probability of a bounce increases. But don't overcomplicate it — the levels themselves are powerful enough.
How much should I risk per trade when trading support and resistance?
Risk 1-2% of your account per trade. On a $1,000 account, that's $10-$20 max risk. Adjust your position size so that your stop loss distance equals this amount.
Quick Recap
- Support = floor where buying pressure stops a downtrend
- Resistance = ceiling where selling pressure stops an uptrend
- Treat them as zones, not exact lines — give 10-15 pips of breathing room
- Bounce strategy is safer; breakout strategy offers higher reward but more false signals
- Old resistance becomes new support (and vice versa) after a breakout
- Multi-timeframe alignment = stronger levels
Your Quick Win (Do This Now)
Open your chart. Pull up EUR/USD on the 1-hour timeframe. Find the last 3 times price reversed at a similar level. Draw a horizontal line through the wicks of those candles. That's your support or resistance zone. Now check if that level aligns with a round number or a previous swing high/low. If it does, you've found a level worth trading.
Do this for 5 currency pairs. In 10 minutes, you'll have a map of the market that most beginners miss.


