
What Makes Supply and Demand Zones Different From Support and Resistance?
Most beginners draw horizontal lines at swing highs and lows and call it analysis. That's support and resistance. And it works — sometimes.
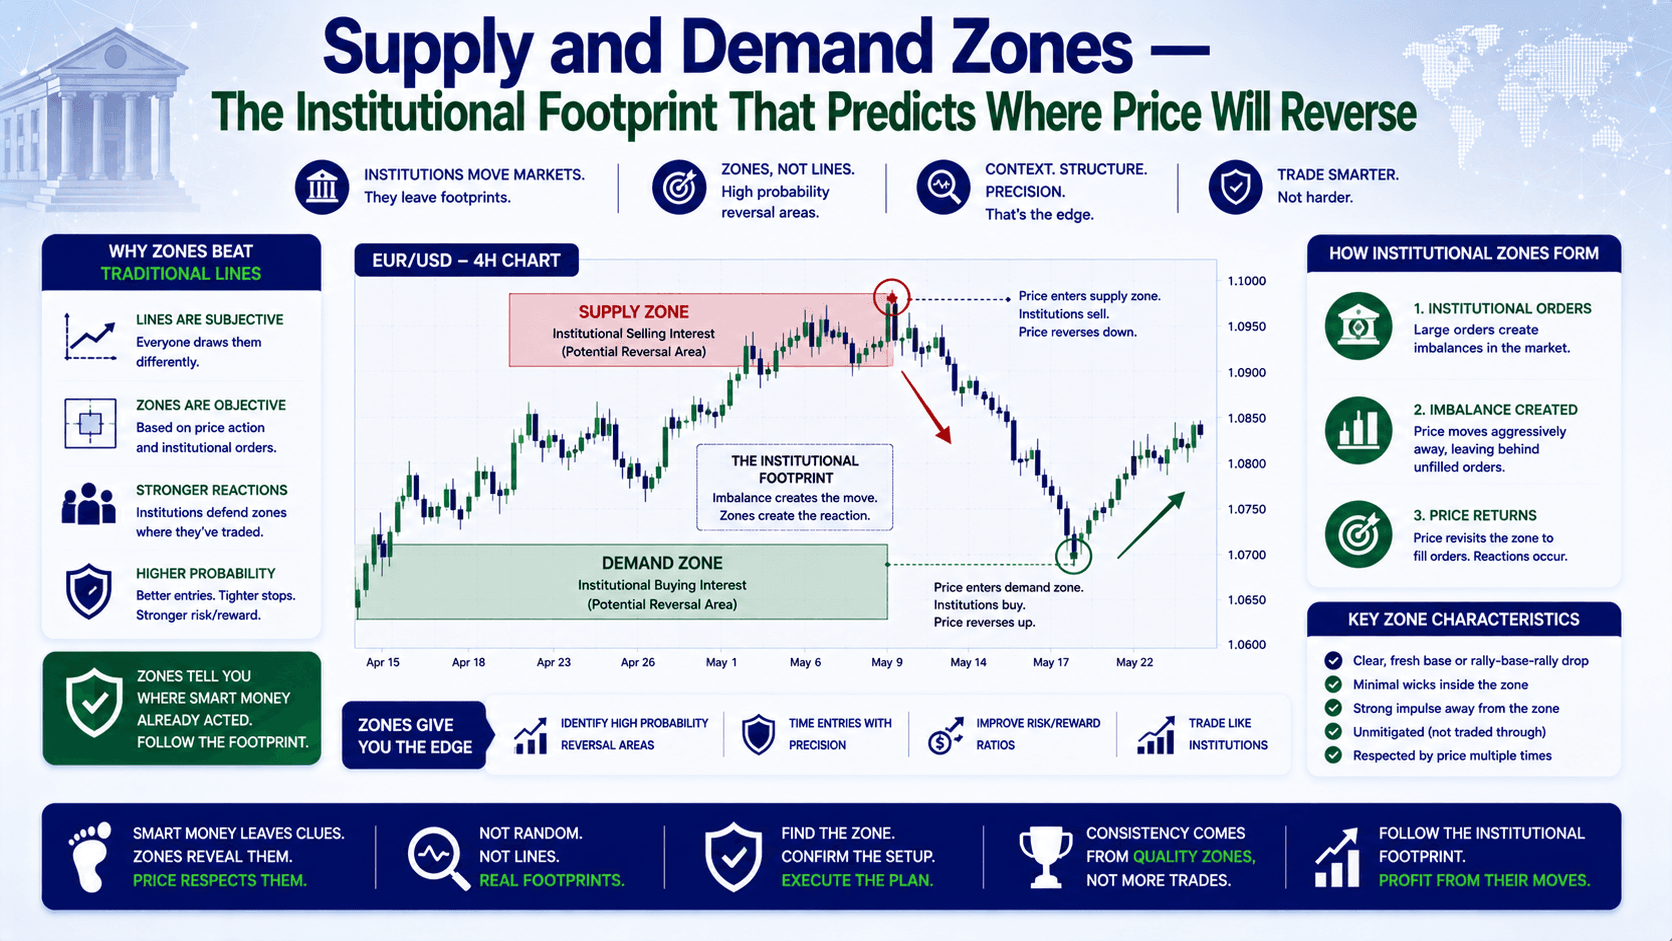
But here's the problem: support and resistance tells you where price reacted. It doesn't tell you why. Supply and demand zones do both.
A demand zone is an area where buying pressure overwhelmed sellers so aggressively that price shot upward like a rocket. A supply zone is where sellers dominated so hard that price collapsed.
The key difference? The aggression of the move. Support and resistance levels get touched multiple times with gentle price action. Supply and demand zones are formed by explosive, impulsive moves — the kind that scream "institutional money just entered."
Think of it this way: support/resistance is the footprint. Supply/demand is the animal that made it.
How to Identify Supply and Demand Zones on Your Charts
The process is simple once you know what to look for. Scan your chart for three things:
1. The Sharp Move
Look for a near-vertical price spike or plunge. We're talking 50-100 pips in a few candles. This is the "run" — institutional orders getting filled aggressively.
Example: EUR/USD is at 1.0850. Suddenly it drops to 1.0780 in 3 candles. That's a 70-pip drop. Something happened. Someone sold in size.
2. The Consolidation Base
Right before that sharp move, price was probably moving sideways in a tight range for 2-30 candles. That's your base — where big players were accumulating or distributing.
For EUR/USD, imagine price consolidated between 1.0840 and 1.0860 for several hours before that 70-pip drop. That 20-pip range is your supply zone.
3. The Volume Spike
If you have volume data, check it. High volume during the base formation confirms institutional participation. Low volume means it might be noise.
The Two Patterns You Need to Know: RBR and DBD
Every supply and demand zone follows one of two patterns. Master these and you'll spot zones in seconds.
| Pattern | What Happens | Zone Type | Trade Direction |
|---|---|---|---|
| Rally-Base-Rally (RBR) | Sharp rally up → consolidation → continuation rally | Demand zone at the base | Buy on retest |
| Drop-Base-Drop (DBD) | Sharp drop down → consolidation → continuation drop | Supply zone at the base | Sell on retest |
Let's make this real. Say GBP/USD drops from 1.2700 to 1.2600 in a straight line — that's 100 pips. Then it consolidates between 1.2600 and 1.2620 for 3 days. Then it drops again to 1.2550. That's a textbook DBD pattern. The supply zone is at 1.2600-1.2620.
How to Draw Supply and Demand Zones Correctly
The most common mistake? Drawing zones too wide. A zone should cover the consolidation base — nothing more.

Step-by-Step:
- Find the sharp move — at least 2x the average candle range
- Identify the base — the consolidation area right before the move
- Draw horizontal lines at the high and low of the base
- For a demand zone: the zone is from the low of the base to the point where the rally started
- For a supply zone: the zone is from the point where the drop started to the high of the base
Example with numbers: AUD/USD rallies from 0.6480 to 0.6580 (100 pips). Then consolidates at 0.6520-0.6540 for 3 days. Your demand zone is 0.6520 (lower) to 0.6580 (upper). Clean and precise.
Trading Supply and Demand Zones — Entry, Stop, Target
You've identified a fresh zone. Now what? Here's a framework that works across all forex pairs.
Entry Methods
- Conservative (recommended): Wait for price to retest the zone. Enter on a reversal candle — bullish engulfing at demand, bearish engulfing at supply.
- Aggressive (higher risk): Enter on the first touch of a fresh, untested zone. Reward is bigger, but so is the chance of a fakeout.
- Breakout pullback: If price breaks the zone but quickly pulls back into it, that's often a great reversal entry.
Stop Loss Placement
- Demand zone: 5-15 pips below the lower boundary
- Supply zone: 5-15 pips above the upper boundary
- This gives price room to breathe without stopping you out on noise
Profit Targets
- Previous swing high/low: The most reliable target
- Measured move: Project the distance of the initial run from the base
- Next major zone: On a higher timeframe
- Risk:reward of 1:2 minimum — always
Let's run a real scenario. You have a $2,000 account. You spot a demand zone on EUR/USD at 1.0820-1.0840. Price retests at 1.0830 with a bullish engulfing candle. You enter long at 1.0835. Stop at 1.0815 (20 pips below zone). Target at 1.0895 (60 pips). Risk: $20 on 0.1 lots. Reward: $60. That's a 1:3 risk-reward ratio.
Common Mistakes That Kill Your Supply and Demand Zone Trading
I've made every mistake on this list. Learn from my pain.
Mistake 1: Drawing Zones Too Wide
If your zone covers 100 pips, it's useless. A good zone is tight — 10-30 pips max. Focus on the consolidation base, not the entire move.
Mistake 2: Trading Weak Zones
Zones lose power every time they get tested. A zone tested 4-5 times is a zone that's already been filled. Stick to "fresh" zones — tested 0-1 times max.
Mistake 3: Ignoring the Trend
Trading a demand zone in a downtrend is like catching a falling knife. It can work, but the odds are against you. Always check the higher timeframe trend first.
Mistake 4: Chasing the Move
Price has already bounced 30 pips from the zone and you're still thinking about entering? Too late. Enter at the zone, not after it.
Mistake 5: Confusing News Spikes With Real Zones
A 100-pip move from an NFP release isn't a supply zone. It's a news event. Real zones form from institutional order flow, not economic data.
Supply and Demand Zones vs Support and Resistance — A Comparison
| Feature | Support & Resistance | Supply & Demand Zones |
|---|---|---|
| What it shows | Where price reacted | Why price reacted (institutional orders) |
| Formation | Multiple touches over time | Explosive move from consolidation |
| Precision | Single line | Zone (price range) |
| Strength indicator | Number of touches | Freshness + aggression of move |
| Best for | Identifying levels | Predicting reversals with high probability |
| Success rate (2024 study) | ~55% | ~68% |
The data suggests supply and demand zones outperform traditional support and resistance. But here's the catch: they require more practice to identify correctly.
FAQ
What is the difference between supply and demand zones and support and resistance?
Support and resistance are lines where price has reacted historically. Supply and demand zones are areas where institutional buying or selling created an explosive move. Zones show the cause of the reaction, not just the effect.

How do I find supply and demand zones in forex?
Look for sharp price moves (50-100 pips) preceded by a tight consolidation base of 2-30 candles. That base is your zone. Mark it with a rectangle on your chart. The fresher the zone, the stronger it is.
What timeframe is best for supply and demand zones?
Daily and 4-hour charts for identifying major zones. 1-hour charts for refining entries. Zones that align across multiple timeframes are the most reliable.
Can I trade supply and demand zones without indicators?
Yes. Many traders use naked charts. The key is identifying the consolidation base and the sharp move. Volume indicators and Fibonacci retracements can help confirm, but they're not required.
Quick Recap
- Supply zones = selling pressure. Demand zones = buying pressure
- Look for RBR (bullish) and DBD (bearish) patterns
- Draw zones tight — cover the consolidation base, not the entire move
- Trade fresh zones (0-1 tests) with a 1:2 risk-reward minimum
- Place stops 5-15 pips beyond the zone boundary
Quick Win: Do This Now
Open your EUR/USD 4-hour chart. Scroll back 2 weeks. Find 3 sharp moves — drops or rallies of at least 50 pips. Trace back to the consolidation area before each move. Draw a rectangle around that area. You've just identified 3 supply or demand zones. Now watch price. If it retests one of those zones, you have a potential trade setup. That's the entire framework.


