
Spinning Top vs Doji Difference — Why Most Traders Get Them Mixed Up
You're scanning your chart. EUR/USD has been trending up for hours. Suddenly, a small-bodied candle appears with long wicks on both sides. Your brain says: "That's indecision. Maybe time to exit."
But here's the thing — is it a spinning top or a doji? And does it even matter?
The short answer: yes. The difference between these two candles can tell you whether the market is mildly uncertain or at a perfect standoff. And that changes how you act.
Let's break down the spinning top vs doji difference — with real numbers, real charts, and a clear framework you can use today.
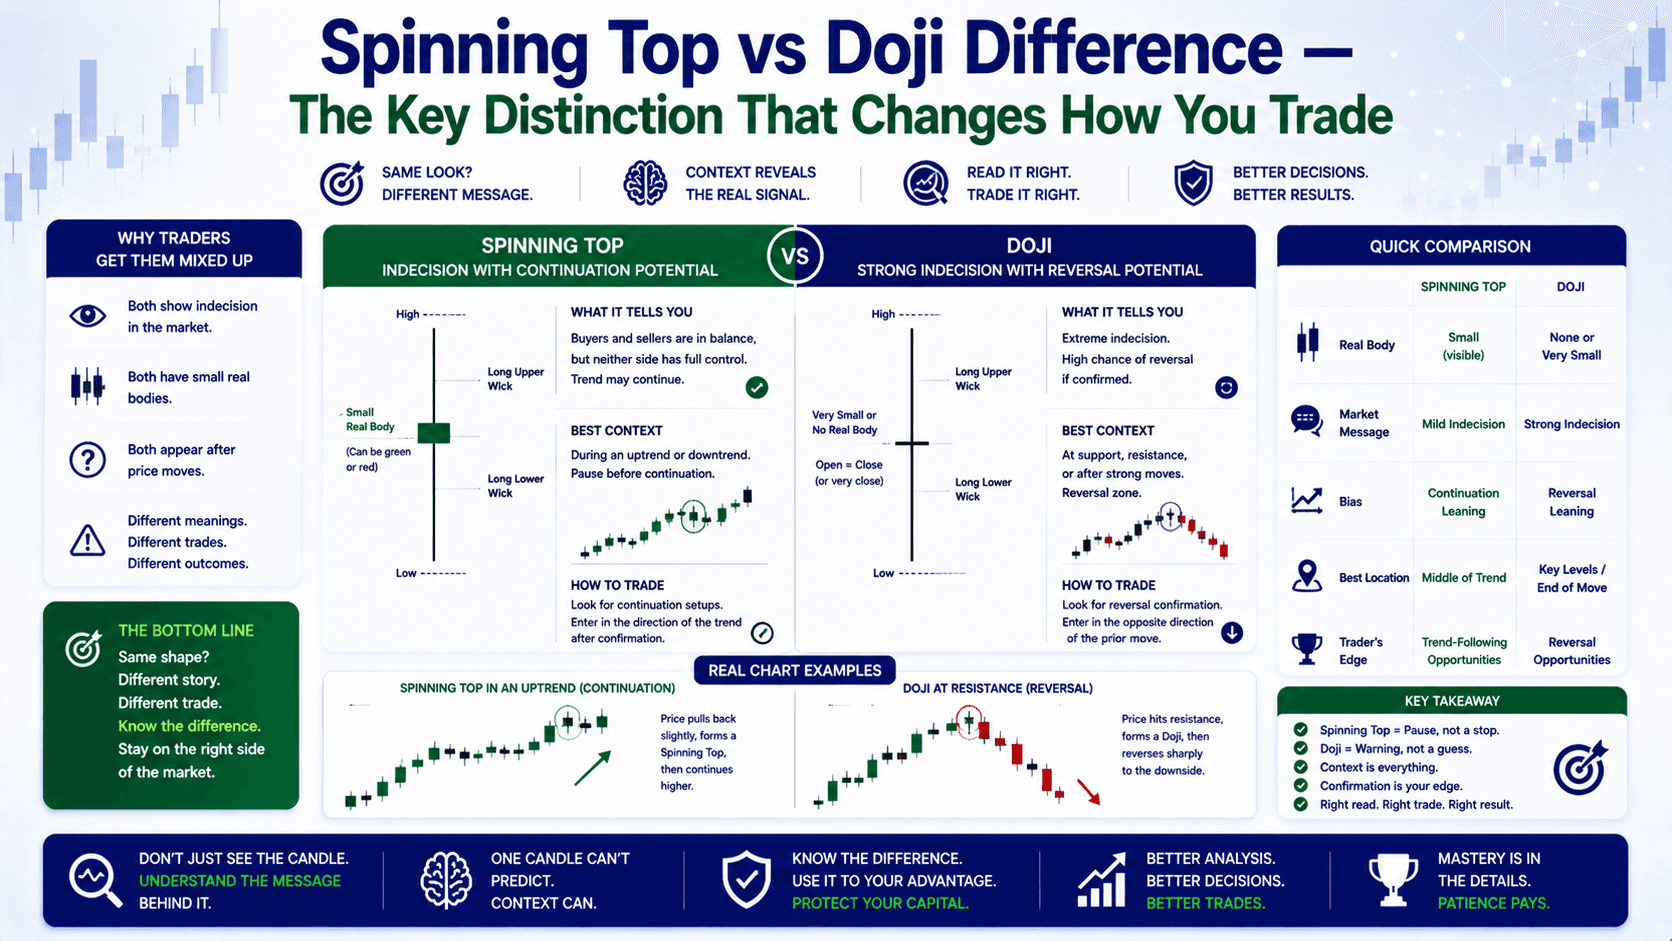
What Is a Spinning Top? (The "Tug-of-War" Candle)
A spinning top has a small real body — meaning the open and close are close, but not identical. The key feature: long upper and lower shadows of roughly equal length.
Here's what that looks like on EUR/USD:
- Open: 1.0850
- High: 1.0868
- Low: 1.0832
- Close: 1.0848
The body is just 2 pips. But the total range? 36 pips. That's a lot of action with almost no net progress.
What it tells you: Both buyers and sellers were active. Bulls pushed price up. Bears pushed it down. But nobody won. The market is undecided, not deadlocked.
A spinning top after a long green candle? Bulls are losing steam. After a long red candle? Bears are running out of gas.
But it's not a reversal signal on its own. It's a pause — a warning that the trend might slow down or change direction.
What Is a Doji? (The "Perfect Standoff" Candle)
A doji takes indecision one step further. The open and close are virtually identical — often within 0.1-0.5 pips. The body is so small it looks like a cross or plus sign.

Example on EUR/USD:
- Open: 1.0850
- High: 1.0865
- Low: 1.0835
- Close: 1.0850
Open and close: exactly the same. Range: 30 pips. Result: zero net movement.
What it tells you: The market reached a perfect equilibrium. Bulls and bears fought to a draw. This is a stronger signal of indecision than a spinning top because the closing price confirms that neither side had any advantage.
Dojis come in different flavors:
- Standard doji: Small body, short shadows
- Dragonfly doji: Long lower shadow, no upper shadow — potential bullish reversal
- Gravestone doji: Long upper shadow, no lower shadow — potential bearish reversal
- Long-legged doji: Long shadows on both sides — extreme indecision
Each variant has its own implication, but all share the core trait: open = close.
Spinning Top vs Doji Difference — The Comparison Table
Here's a side-by-side comparison so you can spot the difference instantly:
| Feature | Spinning Top | Doji |
|---|---|---|
| Real body size | Small, but visible (2-10 pips) | Extremely small or nonexistent (0-1 pip) |
| Open vs Close | Close, but not identical | Virtually equal |
| Shadows | Long, roughly equal on both sides | Vary by type (can be short, long, or one-sided) |
| Visual appearance | Small body with long wicks | Cross or plus sign |
| Strength of indecision | Moderate — tug-of-war | Strong — perfect standoff |
| Reversal signal strength | Weak — needs confirmation | Stronger — especially after a trend |
| Common context | Consolidation, trend pause | Trend exhaustion, potential reversal |
| Example (EUR/USD) | Open 1.0850, Close 1.0848 | Open 1.0850, Close 1.0850 |
The spinning top vs doji difference boils down to one thing: body size. A doji has virtually no body. A spinning top has a small one. That tiny difference changes the market's message.
Wrong Way vs Right Way — How to Trade Each Pattern
The wrong way: You see a spinning top at the top of an uptrend. You immediately go short. Price consolidates for 3 more candles, then resumes the uptrend. You're stopped out.
Why it failed: A spinning top signals indecision, not reversal. You acted on the signal without waiting for confirmation.
The right way: You see a doji after a strong uptrend. You wait. The next candle closes below the doji's low. That's your confirmation. You go short with a stop above the doji's high. Target: the next support level.
Here's a concrete example using EUR/USD:
- Uptrend: EUR/USD rallies from 1.0820 to 1.0880 over 8 candles
- Doji forms at 1.0880: Open 1.0880, High 1.0895, Low 1.0865, Close 1.0880
- Confirmation candle: Next candle closes at 1.0850 (below doji's low of 1.0865)
- Trade: Short at 1.0850, stop at 1.0900 (50 pips), target at 1.0800 (50 pips)
- Risk: 0.1 lots = $50 risk. 1:1 risk-reward. Manageable.
The doji gave you the warning. The confirmation candle gave you the entry. Never trade a doji or spinning top without waiting for the next candle to confirm.
When to Use Each Signal — Practical Scenarios
Scenario 1: Spinning top during a trend
GBP/USD is in a strong downtrend. A spinning top appears. The body is 3 pips, shadows are 15 pips each. What do you do?
Don't cover your short yet. The spinning top says "pause," not "reversal." Wait for the next candle. If it closes lower, the downtrend continues. If it closes higher, consider taking profit.
Scenario 2: Doji at a key level
USD/JPY hits resistance at 150.00. A doji forms with open and close at 149.98. This is a stronger signal because the resistance level and the doji align. Wait for a bearish confirmation candle below the doji's low. Then go short.
Scenario 3: Multiple dojis in a row
If you see 3-4 dojis in a row, the market is extremely indecisive. Don't trade. Wait for a breakout. The longer the consolidation, the stronger the eventual move.
FAQ
Is a spinning top bullish or bearish?
Neither. A spinning top is a neutral pattern that signals indecision. Its meaning depends on the context — whether it appears after an uptrend (potential bearish reversal) or downtrend (potential bullish reversal). Always wait for confirmation.

What is the main difference between a doji and a spinning top?
The main difference is the size of the real body. A doji has an extremely small or nonexistent body (open = close). A spinning top has a small but visible body. This makes a doji a stronger signal of indecision and potential reversal.
Can a spinning top be a reversal pattern?
Yes, but it's a weak reversal signal on its own. A spinning top after a strong trend suggests the trend is losing momentum. However, you need confirmation from the next candle — a close below the spinning top's low (for bearish reversal) or above its high (for bullish reversal).
How do I trade a doji in forex?
Identify the doji after a strong trend. Wait for the next candle to confirm the reversal. For a bullish reversal, the confirmation candle must close above the doji's high. For a bearish reversal, it must close below the doji's low. Set your stop loss above/below the doji's high/low and target the next support/resistance level.
Quick Recap
- Spinning top: Small body, long shadows — indicates indecision, needs confirmation
- Doji: Virtually no body — indicates a perfect standoff, stronger reversal signal
- Key difference: Body size. A doji has open = close. A spinning top has close but not equal.
- Never trade either without confirmation — wait for the next candle to confirm the direction
- Context matters: A doji at a key level is more significant than one in the middle of a range
Quick Win
Open your chart right now. Pull up EUR/USD on the 1-hour timeframe. Scroll back through the last 50 candles. Find one spinning top and one doji. Mark their high and low. Now check what happened on the next 3 candles. Did price confirm the reversal? Or did it continue the trend? This 5-minute exercise will train your eyes to spot the difference — and teach you when to act.


