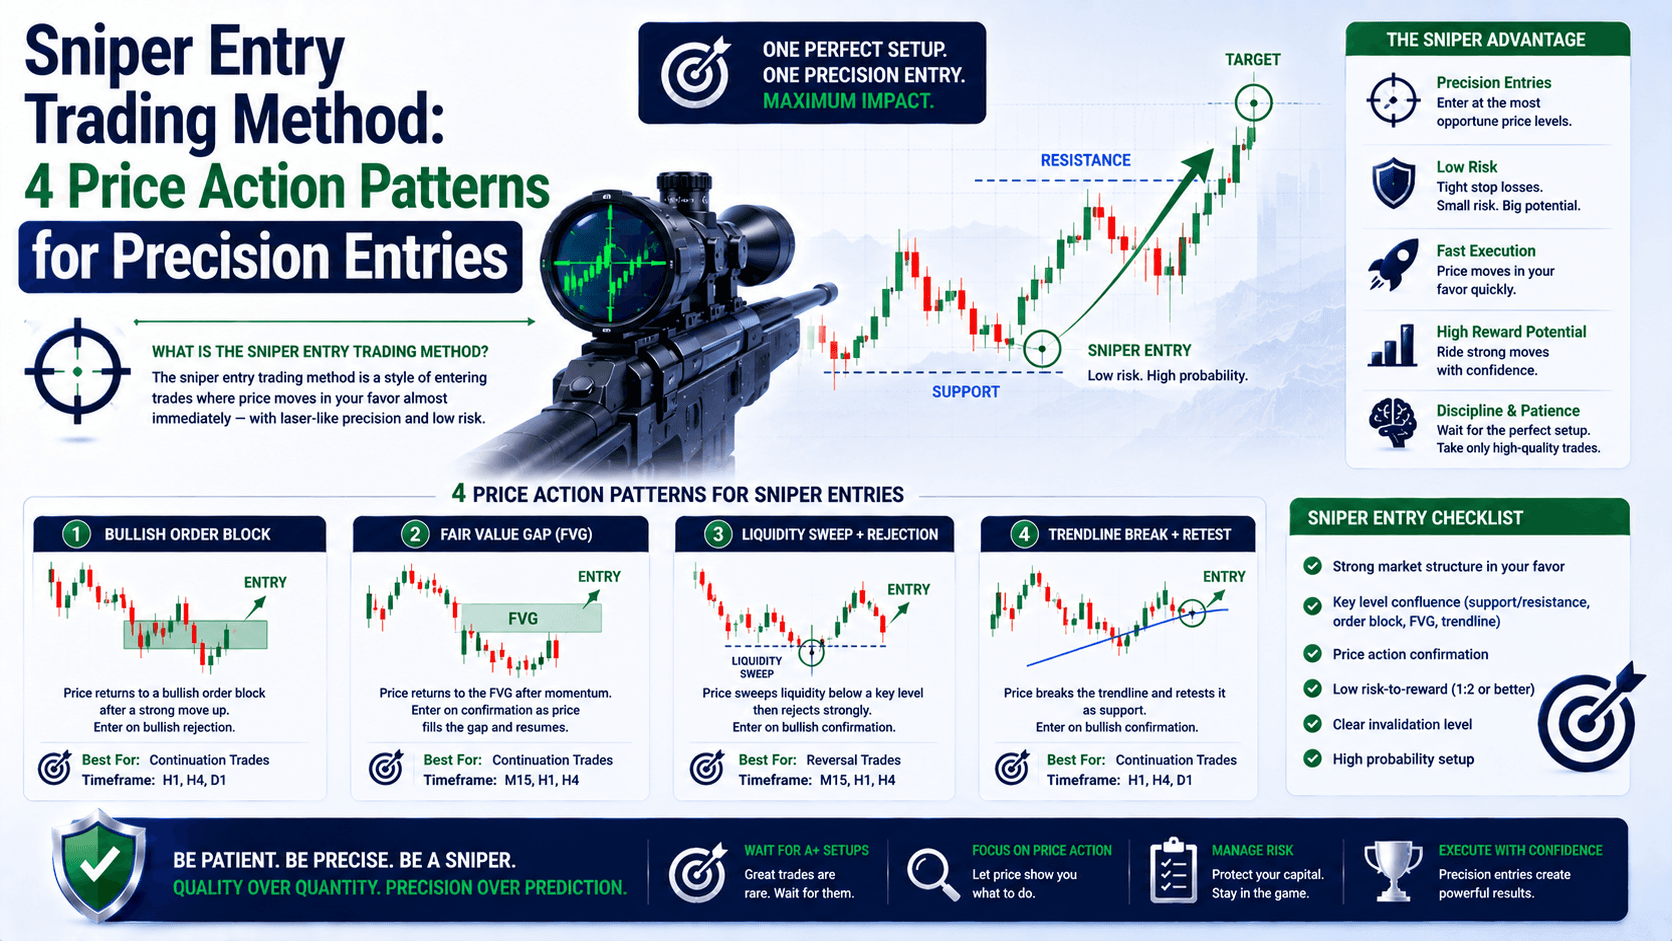

What Is the Sniper Entry Trading Method?
The sniper entry trading method is a style of entering trades where price moves in your favor almost immediately — often with little to no drawdown. Think of it like this: a regular entry is like spraying bullets hoping one hits. A sniper entry is one shot, one hit.
The name comes from the precision required. You're not guessing where price might go. You're waiting for a specific setup that gives you a high-probability entry with a tight stop loss. The goal? Get in, get profit, and get out — without watching your trade go red first.
Here's the deal: most traders enter too early or too late. They see a breakout and chase it, or they try to pick a top or bottom without confirmation. The sniper entry method fixes both problems by forcing you to wait for the market to show its hand first.
Why Most Traders Get Entries Wrong
Before we dive into the patterns, let's look at what goes wrong. Because if you understand the pain, the solution makes more sense.
Scenario: EUR/USD is at 1.0850. You see a big bullish candle and think, "This is it — it's going to 1.0900." You buy at 1.0855. Price immediately drops to 1.0840. You're down 15 pips. You panic and close at 1.0845 — losing 10 pips. Then price rallies to 1.0880 without you.
Sound familiar? That's the cost of impulsive entries. You're reacting to noise instead of waiting for confirmation.
The sniper entry trading method eliminates this by giving you a structured approach. You don't enter because you feel like it. You enter because the market gave you a signal — and you waited for it.
Pattern #1: Breakout With a Buildup
This is the most reliable pattern for catching breakouts that actually follow through.
What to look for:
- The market has been in a range for at least 80 candles (on your chosen timeframe)
- Price consolidates near the resistance level before breaking out
- The 20-period moving average catches up to the consolidation
Here's why this works: when price ranges for a long time, orders accumulate above resistance and below support. Traders who bought at support have stop losses below support. Traders who sold at resistance have stop losses above resistance. When price breaks out, those stop orders get triggered — adding fuel to the move.
Real example — Gold (XAU/USD):
Gold is trading in a range between $2,320 and $2,350 for 4 days on the 1-hour chart. That's roughly 96 candles. You see price start to consolidate near $2,348-$2,350 — tight candles, small ranges. The 20 EMA is at $2,345 and rising toward the consolidation.
Your move: Place a buy stop order at $2,352 (just above resistance). Set your stop loss at $2,344 (below the consolidation low). Target: $2,370 (next resistance level).
Risk: 8 pips × $0.80/pip (0.01 lot) = $6.40. Reward: 18 pips × $0.80/pip = $14.40. Risk:reward = 1:2.25.
Without the buildup, your stop loss would have to go below $2,320 — 32 pips away. That's a much worse risk:reward. The buildup gives you a tight, logical stop.
Pattern #2: First Pullback After a Breakout
Sometimes you miss the initial breakout. That's okay. The first pullback often gives you a second chance — sometimes a better one.

What to look for:
- A clear breakout above resistance (or below support)
- Price pulls back with small-bodied candles (weak selling pressure)
- The 20 MA catches up with the pullback low
This pattern works because breakouts need to breathe. Price can't go straight up forever. The pullback shakes out weak hands and lets the 20 MA catch up, creating a support zone.
Real example — EUR/USD:
EUR/USD breaks above resistance at 1.0850 and rallies to 1.0880. You missed it. Instead of chasing, you wait. Price pulls back to 1.0860 with small-bodied candles. The 20 MA is at 1.0858 and rising.
Your move: Place a buy stop order at 1.0865 (above the pullback high). Stop loss at 1.0852 (below the 20 MA). Target: 1.0920.
Risk: 13 pips × $1.30/pip (0.1 lot) = $16.90. Reward: 55 pips × $1.30/pip = $71.50. Risk:reward = 1:4.2.
Compare this to chasing at 1.0880 — you'd have no logical stop loss and a much worse entry. Waiting for the pullback gave you a better price and a tighter stop.
Pattern #3: False Break (Reversal)
This pattern profits from traders who bought or sold the wrong breakout. It's a reversal pattern that catches them off guard.
What to look for (short setup):
- Price makes a strong bullish move into resistance
- Price briefly breaks above resistance, then closes back below it
- The false break is followed by a bearish candle
Real example — GBP/USD:
GBP/USD is at 1.2650. Resistance is at 1.2680. Price makes a strong move to 1.2690 — breaking resistance. But the next candle closes at 1.2675, back below resistance. The false break trapped buyers who bought the breakout.
Your move: On the next candle's open at 1.2675, go short. Stop loss at 1.2695 (above the false break high). Target: 1.2600.
Risk: 20 pips × $2.00/pip (0.1 lot) = $20.00. Reward: 75 pips × $2.00/pip = $150.00. Risk:reward = 1:7.5.
This pattern works because the false break creates a mini trap. Traders who bought are now underwater and will sell to cut losses — adding to the selling pressure.
Pattern #4: Break of Structure (Trend Reversal)
This pattern catches the beginning of a new trend. It requires multi-timeframe analysis — you need a higher timeframe level AND a lower timeframe structure break.
What to look for (long setup):
- A downtrend approaching a key support level on the higher timeframe (daily or 4-hour)
- On the lower timeframe (1-hour or 30-minute), price forms a higher high and a higher low — breaking the downtrend structure
- You enter on the break above the higher high
Real example — USD/JPY:
On the daily chart, USD/JPY is in a downtrend and approaching support at 148.00. On the 1-hour chart, you see price make a lower low at 148.10, then a higher low at 148.30, then a higher high at 148.60. The downtrend structure is broken.
Your move: Enter long at 148.65 (above the higher high). Stop loss at 148.20 (below the higher low). Target: 149.50.
Risk: 45 pips × $0.45/pip (0.01 lot) = $20.25. Reward: 85 pips × $0.85/pip = $72.25. Risk:reward = 1:3.6.
The key here is the higher timeframe level. Without the support at 148.00, this is just a random bounce. With it, you have confluence — two timeframes agreeing on a reversal zone.
Sniper Entry vs. Regular Entry: Comparison Table
| Factor | Sniper Entry | Regular Entry |
|---|---|---|
| Entry timing | After confirmation | Impulsive or early |
| Drawdown | Minimal (often 0-5 pips) | Can be 20-50+ pips |
| Stop loss placement | Tight, logical (near structure) | Wide or arbitrary |
| Trade frequency | Lower (quality over quantity) | Higher (many false signals) |
| Psychological stress | Low (trade moves in your favor quickly) | High (watching trade go red) |
| Risk:reward | Typically 1:3 or better | Often worse than 1:1 |
FAQ
What is the best timeframe for the sniper entry trading method?
Lower timeframes like 5-minute and 15-minute work best for precise entries. For swing trading, use the 4-hour or 1-hour chart. The key is to use a timeframe where you can clearly see structure and support/resistance levels.

How much capital do I need for sniper entries?
You can start with as little as $100 on a micro account. Use 0.01 lots to keep risk small. The sniper method is about precision, not position size. Focus on the setup first, then scale up as your account grows.
Can I use the sniper entry method for Gold (XAU/USD)?
Absolutely. Gold is highly volatile and often respects support and resistance levels. The breakout with buildup and first pullback patterns work especially well on Gold's 15-minute and 1-hour charts.
How many sniper entry setups should I expect per week?
On a single pair, expect 2-5 setups per week depending on market conditions. The sniper method is about patience. If you're not seeing setups, don't force them. Wait for the market to give you a clear signal.
Quick Recap
- The sniper entry trading method focuses on precision entries with minimal drawdown
- Four key patterns: breakout with buildup, first pullback, false break, and break of structure
- Always wait for confirmation — don't chase price
- Use tight stop losses based on nearby structure
- Quality over quantity: fewer trades, better risk:reward
Your Quick Win
Open your chart right now. Pick any major pair (EUR/USD, GBP/USD, or USD/JPY). Go to the 1-hour timeframe. Look for a range that's been forming for at least 80 candles. Mark the resistance and support levels. Now, watch for a buildup near resistance — tight candles consolidating near the top. That's your next sniper entry setup waiting to happen.


