
SMA vs EMA: The Moving Average Face-Off Every Trader Needs to Understand
Ever stared at your chart, wondering if you should be using a Simple Moving Average (SMA) or an Exponential Moving Average (EMA)? It's like choosing between a slow, steady ship and a fast, agile speedboat. Both get you across the water, but the right choice depends on the waves you're trying to ride.
Most beginners just slap on a 200 SMA or a 50 EMA because "everyone else does." But here's the deal: using the wrong moving average can cost you. It can lead to late entries, missed exits, and getting whipsawed out of perfectly good trades. If you're not using the right tool for the job, you're leaving money on the table.
As Captain TheNextTrade, I've seen traders blow accounts over less. My goal is simple: make you say, "Oh, NOW I get it." We're going to break down SMA vs EMA with real numbers and scenarios, so you can pick the right one for *your* trading style.
Understanding the Basics: What Are Moving Averages?
Think of moving averages as your GPS for price action. They smooth out all the noisy ups and downs on your chart, making it easier to see the underlying trend. They don't predict the future, but they show you where the market has been, which hints at where it might go next.
You input a "period" — say, 20 — and the indicator calculates the average price over the last 20 candles. Plot that average, connect the dots, and boom: you have a moving average line. Simple, right?
But not all moving averages are created equal. The way they calculate that "average" makes all the difference.
The Simple Moving Average (SMA): The Steady Hand
The Simple Moving Average (SMA) is exactly what it sounds like: a simple average. If you're looking at a 20-period SMA, it just adds up the closing prices of the last 20 candles and divides by 20. Every single candle in that 20-period window has the same weight.
This "equal weight" method makes the SMA smooth. It filters out a lot of the noise and short-term volatility. It’s like a super long-exposure photo of the market — you see the main movements, but the quick flickers disappear.
When the SMA Shines (And When It Doesn't)
- Best for: Identifying long-term trends. A 200 SMA is a classic "bull/bear market" indicator. If EUR/USD is consistently above a rising 200 SMA, the bulls are in charge.
- Use case: Confirming the overall direction. If you're considering a short trade on Gold (XAU/USD) but the 50 SMA is clearly pointing up, you might want to reconsider or wait for a pullback.
- Downside: It's slow. Because it gives equal weight to old data, it lags behind price significantly. This means by the time an SMA shows a trend reversal, you might have already missed the first 50-100 pips of the new move.
SMA in Action: A Trend Confirmation Example
Let's say EUR/USD is trading at 1.0850. You're looking at a daily chart. The 50-day SMA is currently at 1.0820 and has been steadily climbing for weeks. This tells you the intermediate trend is up. You might use this as a filter:
Wrong Way: You see a small bearish candle and immediately short 0.1 lots of EUR/USD, hoping for a quick scalp. Your stop is 1.0860. Price rallies, hitting your stop for a $10 loss in minutes, because the larger trend confirmed by the SMA was ignored.
Right Way: With the 50-day SMA confirming an uptrend, you only look for long opportunities. Price dips to 1.0835 (testing the rising 20 SMA), shows a bullish rejection candle. You buy 0.1 lots at 1.0838, stop at 1.0820 (18 pips risk = $18). Target 1.0870 (32 pips target = $32). You're trading *with* the prevailing trend.
The Exponential Moving Average (EMA): The Nimble Scout
The Exponential Moving Average (EMA) is smarter than the SMA. It puts more weight on recent price data. This means a 20-period EMA gives the most recent candle much more importance than a candle from 19 periods ago.

What does this mean for you? The EMA reacts faster to price changes. It hugs the price much closer than the SMA. If there's a sudden shift in momentum, the EMA will curve and change direction quicker.
When the EMA Excels (And When It Misleads)
- Best for: Capturing short-term momentum and earlier trend reversals. Day traders and scalpers love EMAs (like 9, 21, 34 periods) because they provide quicker signals.
- Use case: Timing entries and exits in a fast-moving market. If Gold (XAU/USD) is breaking out, a 9 EMA crossover above price could be your signal to enter.
- Downside: Because it's so responsive, the EMA is prone to more "fakeouts" in choppy, sideways markets. It can give you buy signals right before price reverses, or sell signals just before it bounces.
EMA in Action: A Quick Entry Example
It's London session. GBP/USD is trending up strongly on the 1-hour chart, but you want to find an entry on the 15-minute. The 21-period EMA is your friend here.
Wrong Way: You see a strong green candle and FOMO buy 0.5 lots of GBP/USD at 1.2780 without waiting for a confirmation. Stop loss is too tight at 1.2770. Price pulls back to the 21 EMA at 1.2765, hits your stop for a $50 loss, then bounces hard to 1.2820. You got stopped out by 5 pips.
Right Way: You wait for GBP/USD to pull back to the 21 EMA. It touches 1.2765, then forms a bullish pin bar. You enter a long position with 0.5 lots at 1.2770. Your stop loss is 1.2750 (20 pips risk = $100). Target 1.2820 (50 pips target = $250). You used the EMA for a precise entry point after a pullback.
EMA vs SMA: The Core Differences & When to Choose
So, which moving average is better for you? The truth is, neither is inherently "better." They just have different strengths and weaknesses. The optimal choice depends entirely on your trading style, your timeframe, and the market conditions.
Comparing the Characteristics
Here's a quick rundown to help you decide:
| Characteristic | Simple Moving Average (SMA) | Exponential Moving Average (EMA) |
|---|---|---|
| Calculation Method | Equal weight to all prices in period | More weight to recent prices |
| Responsiveness | Slower to react to price changes | Faster to react to price changes |
| Lag | Higher (more delayed signals) | Lower (quicker signals) |
| Smoothness | Smoother, less prone to minor fluctuations | More volatile, closely follows price |
| Best For | Identifying long-term trends, support/resistance, less volatile markets | Timing entries/exits, short-term trends, volatile markets |
| Risk | Delayed signals might mean worse entry/exit prices | More fakeouts in choppy markets, higher chance of whipsaw |
The Right Tool for the Right Job
- For long-term trend traders (swing, position): SMAs (50, 100, 200 periods) are your anchor. Use them on daily or weekly charts to confirm the big picture trend. They'll save you from chasing every little price fluctuation.
- For short-term traders (day, scalping): EMAs (9, 21, 34 periods) are your trigger. Use them on 5-minute, 15-minute, or 1-hour charts to get quicker entry and exit signals. They help you ride short-term momentum.
Captain's Combo: Using Both SMA and EMA for a Sniper's Edge
This is where most traders miss out. You don't have to pick just one! Professional traders often use a combination of both SMA and EMA to get the best of both worlds: the stability of the SMA for the overall trend, and the responsiveness of the EMA for precise entries.
Here's a common strategy:
- Identify the higher timeframe trend with an SMA: On a 4-hour chart for USD/JPY, if the 50 SMA is rising, you know the intermediate trend is up.
- Zoom in and time your entry with an EMA: Drop down to the 1-hour or 30-minute chart. Wait for price to pull back to a shorter EMA (like the 21 EMA) and show a bullish rejection. This gives you a high-probability entry *within* the larger trend.
Scenario Breakdown: Combining MAs on Gold
It's a volatile Tuesday morning. Gold (XAU/USD) is trading at $2350. The 200-period SMA on the 4-hour chart is clearly pointing up, confirming a strong uptrend.
You then switch to the 15-minute chart. Price pulls back to the 21-period EMA at $2345. A clear bullish hammer candle forms right on the EMA.
- Entry: Buy 0.05 lots of XAU/USD at $2346.00.
- Stop Loss: $2342.00 (40 pips below the EMA, gives breathing room). That's a $20 risk (0.05 lots * $10/pip * 4 pips = $20).
- Target: $2358.00 (120 pips target). That's a $60 profit (0.05 lots * $10/pip * 12 pips = $60). Risk:reward = 1:3.
By combining the 4-hour SMA for trend direction and the 15-minute EMA for entry timing, you've got a high-probability setup with good risk-reward. You're not guessing anymore, you're navigating with data.
Common Traps When Using Moving Averages
Here are a few mistakes even experienced traders make:
- Over-reliance: Moving averages are indicators, not crystal balls. Use them as part of a larger strategy, not as your only decision-making tool. Combine them with support/resistance, candlestick patterns, or momentum oscillators.
- Using the wrong period: A 9 EMA on a daily chart for a swing trade is usually too fast and will whipsaw you. A 200 SMA on a 1-minute chart is too slow and will barely move. Match your MA period to your timeframe and trading style.
- Ignoring market conditions: In a strong, clear trend, EMAs work beautifully. In a choppy, range-bound market, both SMAs and EMAs will give you false signals left and right. Know when to step aside.
FAQ
Is SMA or EMA better for day trading?
For day trading, EMA is generally preferred because it reacts faster to recent price changes, offering quicker signals for short-term opportunities.

Can SMA and EMA be used together in a trading strategy?
Absolutely. Many advanced traders use a longer-period SMA (e.g., 50 or 200) for overall trend identification and a shorter-period EMA (e.g., 9 or 21) for precise entry and exit timing.
What are common periods for SMA and EMA?
Common SMA periods include 50, 100, and 200 for longer-term trends. For EMA, common periods are 9, 21, 34, and 50, used for shorter-term momentum and entry signals.
Why does EMA react faster than SMA?
EMA reacts faster because its calculation gives more weight to the most recent price data, making it more responsive to current market sentiment and shifts.
Quick Recap
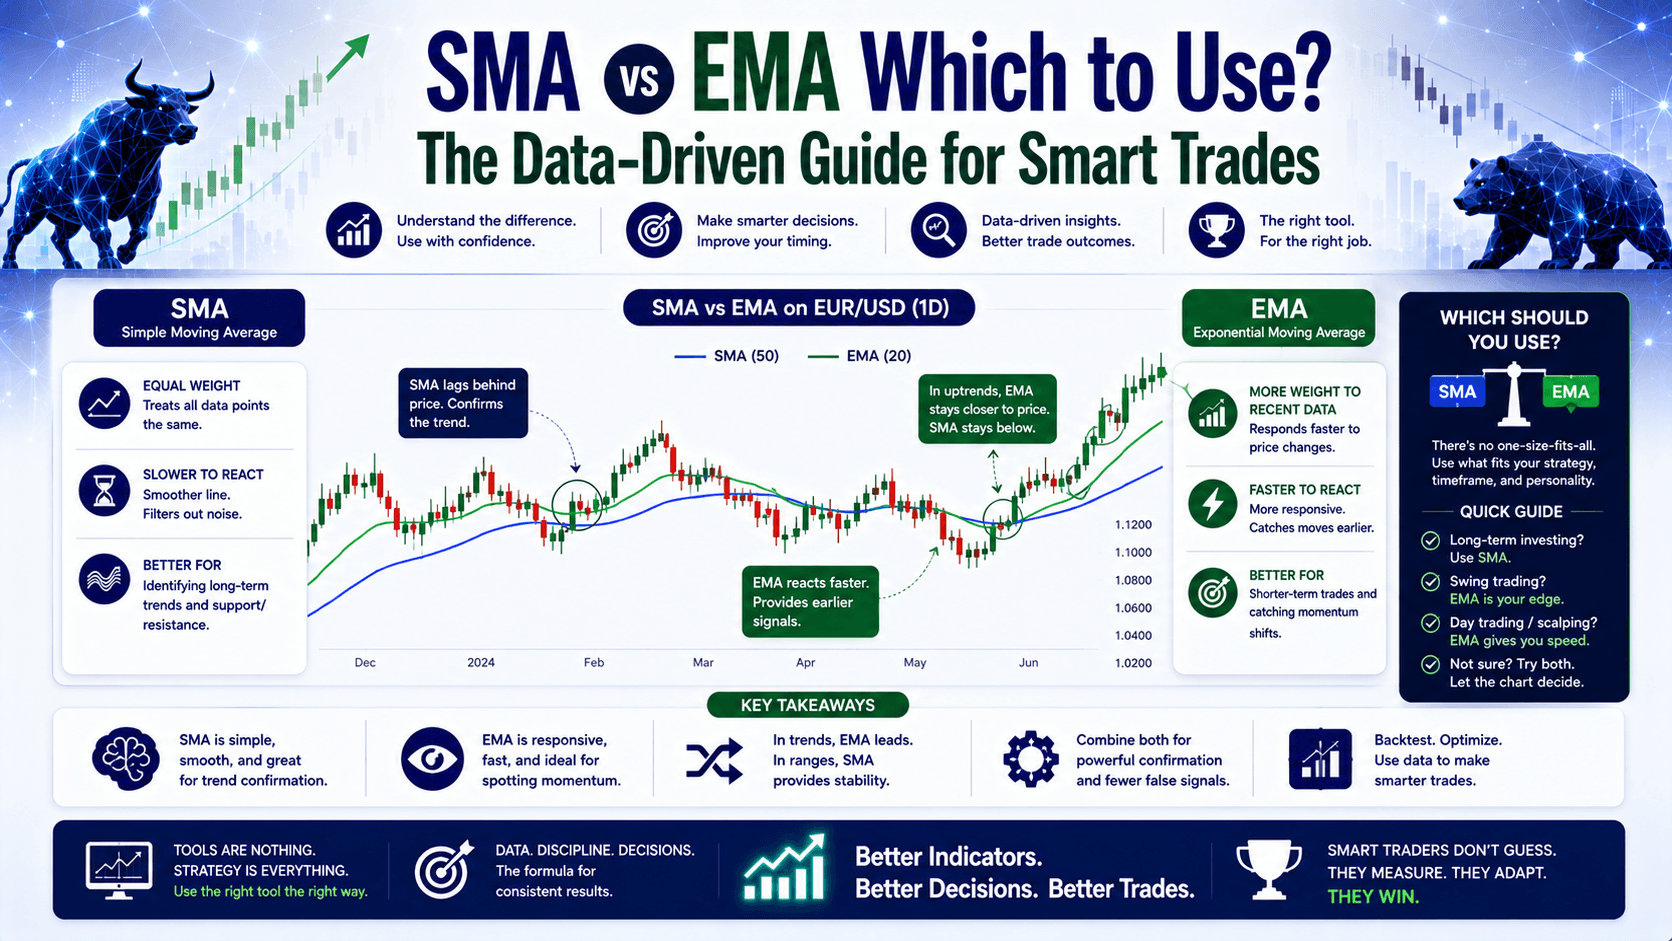
- SMA (Simple Moving Average): Calculates a plain average, smooths price, lags more, best for long-term trends and overall market direction.
- EMA (Exponential Moving Average): Weights recent prices more, reacts faster, hugs price closer, best for short-term momentum and precise entries/exits.
- No "Better" Option: The choice depends on your trading style, timeframe, and market conditions.
- The Power Combo: Smart traders use SMAs for the big picture trend and EMAs for timing their trades.
- Avoid Traps: Don't rely solely on MAs, match periods to your timeframe, and always consider current market conditions.
Quick Win: Test Your MAs Today
Open your chart right now. Pull up EUR/USD on the 1-hour timeframe. Add a 50-period SMA and a 21-period EMA. Watch how they interact with price. Notice how the EMA moves much closer to price, while the SMA lags behind. Pay attention to how often the EMA crosses price (many fakeouts!) versus the SMA. Then, try using the 50 SMA for direction and waiting for price to pullback to the 21 EMA to look for entries. Practice seeing this difference in real-time — it’s the fastest way to get it.


