
What is the Shooting Star Candlestick Pattern? The Short Version
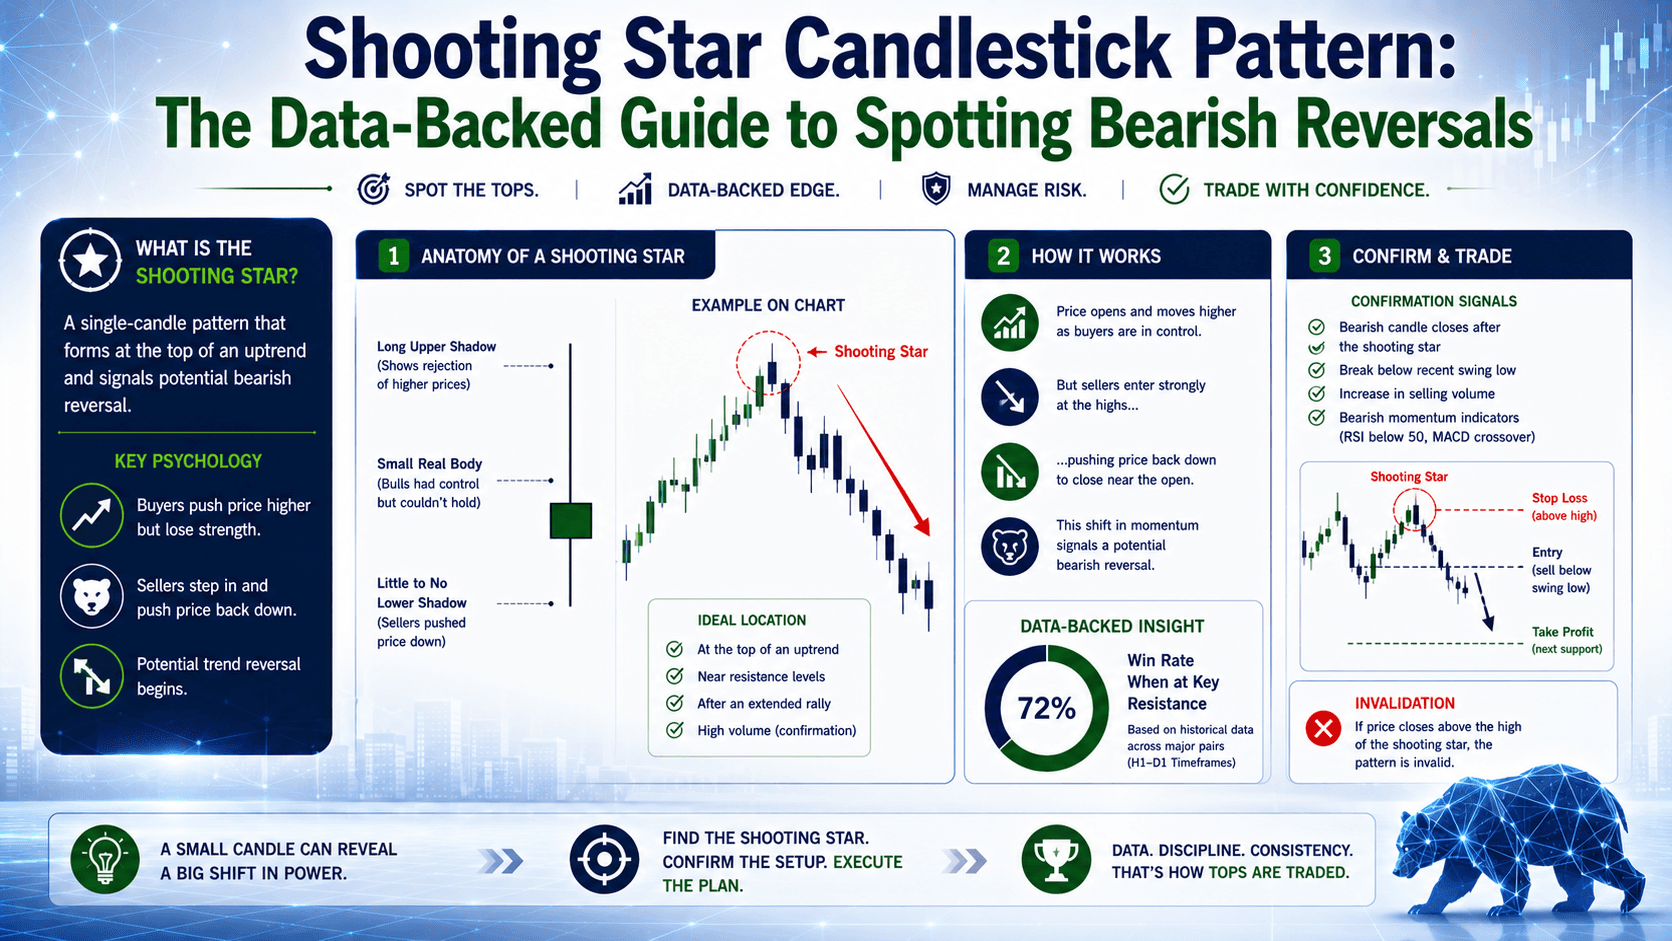
The shooting star candlestick is a single-candle pattern that signals a potential bearish reversal. It forms after an uptrend and tells you one thing: buyers tried to push price higher, failed, and sellers took control.
Here's what it looks like on any chart — EUR/USD, Gold, or stocks:
- Long upper shadow (wick) — at least 2x the length of the body
- Small real body — open and close are very close together
- Little to no lower shadow — price never dipped much below the open
The name comes from the visual. The candle looks like a shooting star streaking across the sky — small body at the bottom, long tail above.
But here's the thing most beginners get wrong: the shooting star alone is not a trade signal. It's a warning. A red flag. Not a guaranteed reversal.
How to Identify a Reliable Shooting Star — The 4 Criteria
Not every candle with a long wick is a valid shooting star. Here's the exact checklist:
| Criterion | Requirement | Why It Matters |
|---|---|---|
| Trend context | Must appear after a clear uptrend | A shooting star in a downtrend is meaningless — it's just a random candle |
| Upper shadow length | At least 2x the body length | Shows buyers pushed hard but failed to hold gains |
| Body size | Small (ideally a doji or near-doji) | Tells you the battle between bulls and bears ended in a draw |
| Lower shadow | Very small or nonexistent | Confirms sellers didn't let price bounce back up |
Let's look at a real example. EUR/USD rallies from 1.0820 to 1.0950 over 5 days. On day 6, price opens at 1.0945, spikes to 1.0970, then closes at 1.0935. The upper shadow is 25 pips. The body is 10 pips. That's a 2.5:1 ratio. That's a valid shooting star.
On the other hand, if EUR/USD is already in a downtrend and you see a long-wick candle — ignore it. That's not a shooting star. That's noise.
Why the Shooting Star Works — The Battle Between Bulls and Bears
Every candlestick tells a story. The shooting star tells the story of a failed breakout.

Here's the narrative:
The market has been trending up for days or weeks. Bulls are confident. They push price higher at the open. Momentum builds. New buyers pile in. Price reaches a new high.
Then something happens. Sellers step in. Or buyers run out of steam. Price reverses sharply and closes near where it opened.
The long upper shadow represents that failed attempt. The small body shows that despite all that buying pressure, the close was essentially flat. The bulls spent their energy and got nowhere.
This is where the loss aversion hook kicks in: if you ignore this signal, you're risking giving back all the gains from the entire uptrend. One shooting star can mark the top of a move that took weeks to build.
Shooting Star vs. Inverted Hammer — The Critical Difference
These two patterns look identical but mean the opposite. The difference is context.
| Feature | Shooting Star | Inverted Hammer |
|---|---|---|
| Appears after | Uptrend | Downtrend |
| Signal | Bearish reversal | Bullish reversal |
| What it means | Buyers failed, sellers taking over | Sellers failed, buyers taking over |
| Body color | Red (bearish) preferred but not required | Green (bullish) preferred but not required |
The data suggests most beginners confuse these two. If you see a long-wick candle, always check the trend first. Shooting star = top of uptrend. Inverted hammer = bottom of downtrend.
How to Trade the Shooting Star — A Step-by-Step Strategy
Let's walk through a real trade scenario using EUR/USD.
Step 1: Identify the setup
EUR/USD rallies from 1.0820 to 1.0950. A shooting star forms at 1.0950 with a 25-pip upper shadow and a 10-pip body. No lower shadow. This happens near a prior resistance level from 3 weeks ago.
Step 2: Wait for confirmation
This is where most beginners fail. They see the shooting star and short immediately. Don't do that. Wait for the next candle to close below the shooting star's low (1.0930).
Why? Because the shooting star is a warning, not a trigger. Confirmation reduces false signals significantly.
Step 3: Enter the trade
Once the next candle closes below 1.0930, enter short. Place your stop loss above the shooting star's high (1.0970). Your risk: 40 pips.
Step 4: Set your target
A reasonable target is the next support level. In this case, 1.0850 — a level from the prior week. That's 80 pips of potential profit. Risk:reward = 1:2.
Step 5: Manage the trade
If price drops 40 pips (to 1.0890), move your stop to breakeven. This eliminates risk. Let the rest run to target.
On a 0.1 lot position, that's $40 risk for $80 potential profit. On 0.5 lots, it's $200 risk for $400 potential profit.
Common Mistakes That Kill Shooting Star Trades
Here are the traps that cost traders real money:
- Trading without confirmation. The shooting star alone has a false signal rate of 30-40%. Adding a bearish follow-through candle drops that to under 20%.
- Ignoring the trend. A shooting star in a weak uptrend is less reliable than one in a strong, extended uptrend. The stronger the prior move, the more significant the reversal signal.
- Setting stops too tight. If you place your stop right at the shooting star's high, a single spike can take you out. Give it 2-3 pips of breathing room.
- Taking profits too early. Shooting stars can signal reversals that last days or weeks. Don't exit at the first pullback. Let your target work.
FAQ
Is the shooting star candlestick pattern always bearish?
Yes, the shooting star candlestick is always a bearish reversal signal. But it only works in the context of an uptrend. In a downtrend, the same candle shape is called an inverted hammer and signals a bullish reversal.

What is the difference between a shooting star and a hanging man?
The hanging man appears after an uptrend and has a long lower shadow. The shooting star has a long upper shadow. Both are bearish reversal signals, but the hanging man shows sellers pushed price down and buyers fought back.
Can a shooting star form on any timeframe?
Yes. Shooting stars work on 5-minute, 1-hour, daily, and weekly charts. The higher the timeframe, the more significant the signal. A daily shooting star is more reliable than a 5-minute one.
What is the success rate of the shooting star pattern?
Studies show a 60-70% success rate when confirmed by a bearish follow-through candle. Without confirmation, the rate drops to 40-50%. Always use confirmation.
Quick Recap
- The shooting star candlestick is a bearish reversal pattern that forms after an uptrend
- It has a long upper shadow (2x body), small body, and little to no lower shadow
- Always wait for confirmation — a bearish candle closing below the shooting star's low
- Combine with resistance levels or RSI overbought for higher probability setups
- Risk:reward of 1:2 or better is the standard target
Quick Win — Do This Now
Open your chart and pull up EUR/USD on the daily timeframe. Scroll back through the last 2 months. Find every candle with an upper shadow at least 2x the body. Note where they formed — near resistance levels? After a 5-day rally? That's your shooting star training data. Do this for 10 minutes and you'll spot them in real-time without thinking.


