
You See a Pattern. But Is It a Pause or a Turn?
You're staring at your chart. EUR/USD has been trending up for three days. Suddenly, the candles start compressing into a triangle. Your gut says "this is going to keep going up." But a little voice whispers: "What if it's about to reverse?"
That's the million-dollar question every trader faces. And here's the uncomfortable truth: most beginners get it wrong because they don't have a system for telling the two apart.
Let's fix that. Right now.
I'm going to show you exactly how to distinguish reversal vs continuation patterns — using real numbers, real chart logic, and a framework that removes the guesswork.
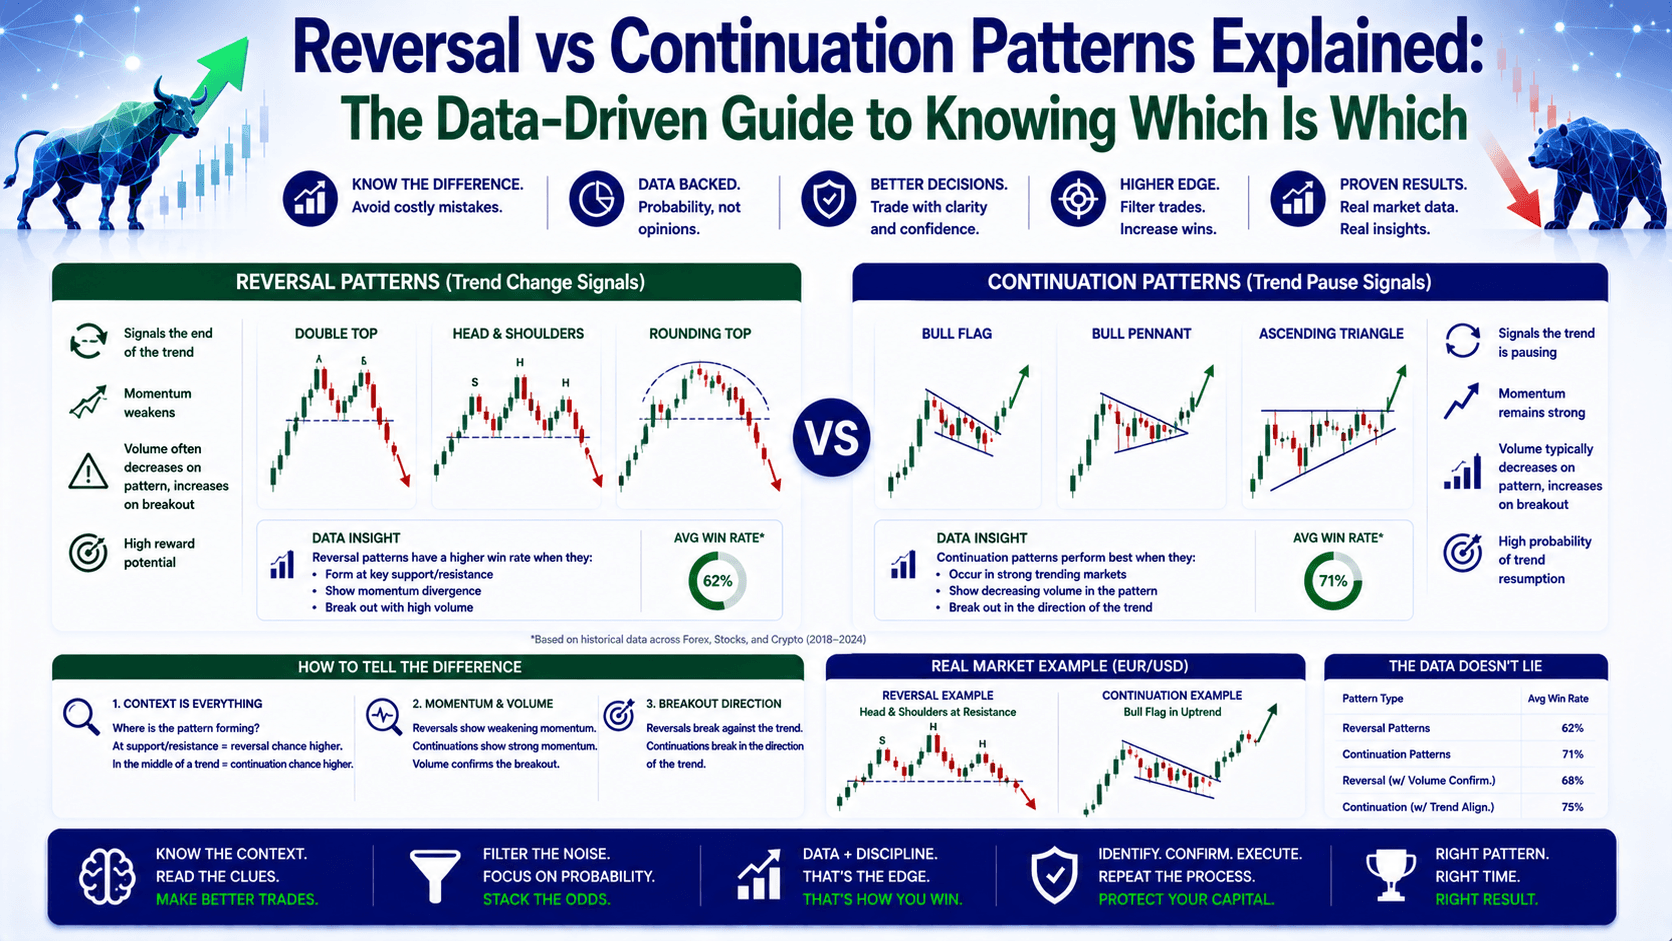
The Core Difference: Momentum vs Exhaustion
Here's the simplest way to think about it. Continuation patterns are the market catching its breath. Reversal patterns are the market throwing in the towel.
Let's break that down with data.
What Continuation Patterns Tell You
A continuation pattern forms when the market pauses within an established trend. The trend is still strong — it just needs a moment to consolidate before the next leg.
Key characteristics:
- Pattern forms within the trend, not at the end of it
- Volume typically decreases during the pattern, then spikes on the breakout
- The breakout goes in the same direction as the prior trend
What Reversal Patterns Tell You
A reversal pattern forms when the trend is losing steam. Buyers are exhausted (in an uptrend) or sellers are exhausted (in a downtrend). The pattern signals a shift in control.
Key characteristics:
- Pattern forms after a prolonged trend
- Volume often spikes at the pattern's completion
- The breakout goes in the opposite direction of the prior trend
Continuation vs Reversal: A Side-by-Side Comparison
Here's a table that shows you exactly how they stack up. Bookmark this.

| Factor | Continuation Pattern | Reversal Pattern |
|---|---|---|
| Trend stage | Mid-trend, during a healthy pullback | End of trend, after a strong move |
| Volume during formation | Declines (less conviction during pause) | Can spike (battle between buyers and sellers) |
| Volume at breakout | Spikes strongly | Spikes, but often with hesitation |
| Breakout direction | Same as prior trend | Opposite of prior trend |
| Typical patterns | Flags, Pennants, Rectangles, Triangles | Head & Shoulders, Double Top/Bottom, Wedges |
| Probability of success | Higher (trend is your friend) | Lower (catching a top/bottom is harder) |
| Risk of false breakout | Lower | Higher |
The 3 Most Common Continuation Patterns (With Real Numbers)
Let's look at the patterns you'll see most often — and how to trade them with actual dollar amounts.
1. The Bull Flag — Your Best Friend in an Uptrend
GBP/USD rallies from 1.2600 to 1.2750 — a clean 150-pip move. Then it pulls back into a tight channel sloping down. That's your flag.
The trade: Enter at 1.2730 (above the flag's resistance). Stop at 1.2680 (below the flag's support). Target: 1.2880 (flag pole height of 150 pips added to breakout point).
The math on 0.1 lots: Risk = 50 pips × $1 = $50. Reward = 150 pips × $1 = $150. Risk:Reward = 1:3. That's a trade worth taking.
2. The Symmetrical Triangle — Let Price Tell You Where
EUR/USD is in an uptrend. It starts making lower highs and higher lows — converging trendlines. The triangle is about 40 pips tall at its widest point.
The trade: Wait for a breakout above the upper trendline. Enter at 1.0875. Stop at 1.0855 (20 pips below the breakout). Target: 1.0915 (40 pips — the triangle's height).
The math on 0.05 lots: Risk = 20 pips × $0.50 = $10. Reward = 40 pips × $0.50 = $20. Risk:Reward = 1:2.
3. The Bullish Pennant — Fast and Furious
Gold (XAU/USD) spikes from $2,350 to $2,400 in 2 hours. Then it consolidates into a tiny symmetrical triangle — the pennant. The mast is 50 points tall.
The trade: Enter at $2,405 (above the pennant). Stop at $2,395 (below the pennant). Target: $2,455 (mast height of 50 points).
The math on 0.1 lots (Gold): Risk = $10 × 10 points = $100. Reward = $10 × 50 points = $500. Risk:Reward = 1:5. These can be explosive.
The 3 Most Common Reversal Patterns (With Real Numbers)
Now let's look at the patterns that signal the party is over.
1. Head and Shoulders — The Classic Top
EUR/USD has been rallying for weeks. It makes a high at 1.0950 (left shoulder), pulls back to 1.0900, then rallies to 1.1000 (head), pulls back to 1.0900 again, then rallies to 1.0930 (right shoulder). The neckline is at 1.0900.
The trade: Enter short at 1.0890 (below the neckline). Stop at 1.0950 (above the right shoulder). Target: 1.0800 (head height of 100 pips subtracted from neckline).
The math on 0.1 lots: Risk = 60 pips × $1 = $60. Reward = 90 pips × $1 = $90. Risk:Reward = 1:1.5.
2. Double Top — Two Strikes and You're Out
USD/JPY hits 152.00, pulls back to 151.00, then tries to break 152.00 again but fails. It forms a clear double top.
The trade: Enter short at 150.80 (below the pullback low). Stop at 152.20 (above the second top). Target: 149.80 (height from top to pullback = 100 pips).
The math on 0.05 lots: Risk = 140 pips × ¥0.50 = ¥70 (about $0.47). Reward = 100 pips × ¥0.50 = ¥50 (about $0.33). Wait — that's a negative R:R. That's why you need to be selective. Only trade reversals when the R:R is at least 1:1.5.
3. Falling Wedge — The Bullish Reversal
GBP/USD has been in a downtrend, making lower highs and lower lows, but the range is narrowing. The wedge is sloping down. This is a bullish reversal signal.
The trade: Enter long at 1.2650 (above the wedge's upper trendline). Stop at 1.2620 (below the last low). Target: 1.2720 (wedge height of 70 pips).
The math on 0.1 lots: Risk = 30 pips × $1 = $30. Reward = 70 pips × $1 = $70. Risk:Reward = 1:2.3.
The Wrong Way vs The Right Way
Let me show you the mistake 90% of beginners make — and how to fix it.
The wrong way: You see a head and shoulders pattern on EUR/USD. You immediately go short. But the pattern formed in the middle of a strong uptrend, not at the end. The "reversal" fails, price breaks above the neckline, and you're stopped out for a loss.
The right way: Before trading any pattern, ask yourself: "Where is this pattern in the trend?" If it's mid-trend, it's probably a continuation. If it's at the end of a long, extended move, it's probably a reversal.
Here's a simple rule: Don't trade a reversal pattern unless the prior trend has been running for at least 20-30 bars on your timeframe.
FAQ
Can a wedge pattern be both a continuation and a reversal?
Yes. A rising wedge in a downtrend is usually a continuation (bearish). A rising wedge in an uptrend is usually a reversal (bearish). The trend context determines the signal.

Which is easier to trade — continuation or reversal patterns?
Continuation patterns have a higher win rate because you're trading with the trend. Reversal patterns are harder because you're trying to catch a top or bottom. Start with continuations.
How much should I risk on a chart pattern trade?
Risk 1-2% of your account per trade. On a $1,000 account, that's $10-$20 max loss per trade. Adjust your lot size to match.
What's the best timeframe for trading chart patterns?
The 1-hour and 4-hour timeframes offer the best balance of reliability and frequency. Lower timeframes have more false signals.
Quick Recap
- Continuation patterns = trend pauses, then resumes. Trade with the trend.
- Reversal patterns = trend ends, new trend begins. Trade against the prior trend.
- Always check trend context before deciding which type you're looking at.
- Use volume to confirm breakouts — weak volume = likely false signal.
- Risk 1-2% per trade and aim for at least a 1:2 risk:reward ratio.
Quick Win: Do This Right Now
Open your chart. Pull up EUR/USD on the 1-hour timeframe. Scroll back 48 hours. Find one pattern that looks like a continuation and one that looks like a reversal. Draw the trendlines. Measure the height. Calculate the risk:reward if you had taken the trade. Do this for 5 pairs. You'll start seeing the difference instantly.


