
What Is a Rectangle Pattern in Trading?
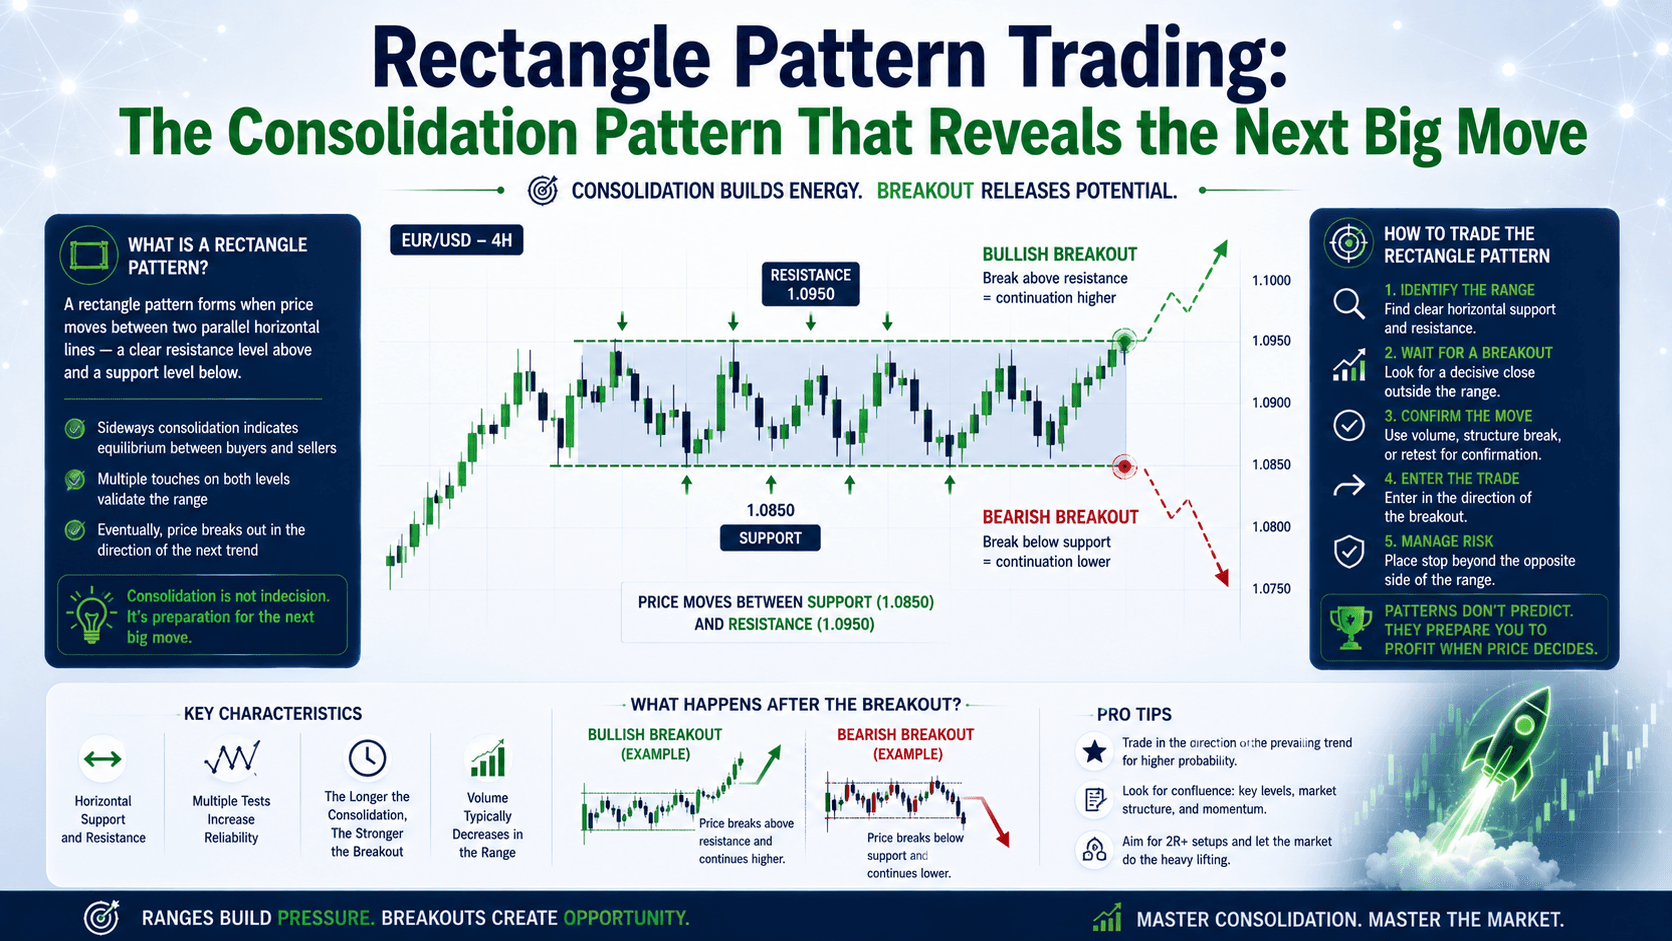
A rectangle pattern forms when price moves between two parallel horizontal lines — a clear resistance level above and a clear support level below. Think of it as a boxing ring where buyers and sellers are evenly matched, throwing punches but neither winning. The price bounces between these two lines until one side finally breaks through.
Here's the deal: this pattern signals a period of consolidation or indecision. The market is catching its breath before making its next move. And that move? It's often explosive.
Let's compare the rectangle to other common patterns to see where it fits:
| Pattern | Shape | Trend Required | Outcome |
|---|---|---|---|
| Rectangle | Horizontal parallel lines | Prior trend (for continuation) | Breakout in direction of prior trend (usually) |
| Triangle | Converging diagonal lines | Prior trend | Breakout in direction of prior trend |
| Flag/Pennant | Sloping parallel lines (flag) or converging lines (pennant) | Strong prior trend | Sharp continuation of prior trend |
| Double Top/Bottom | Two peaks or troughs at similar levels | Prior trend | Reversal of prior trend |
The data suggests rectangles are continuation patterns roughly 67% of the time. That means if price was trending up before the rectangle formed, the breakout is likely to be upward. The opposite is true for a downtrend.
How to Identify a Rectangle Pattern on Your Chart
You need at least two touches on both the support and resistance lines to confirm the pattern. Anything less could be a double top or bottom — which signals a reversal, not a continuation.
Here's what to look for:
- Parallel horizontal lines — The support and resistance must be roughly parallel. If they're converging, it's a triangle.
- Multiple touches — Price should test each level at least twice. The more touches, the stronger the pattern.
- Prior trend — The rectangle should appear after a clear trend (up or down).
- Volume declining inside the rectangle — This shows indecision. Volume should spike on the breakout.
Let's see this in action with a real example. Imagine EUR/USD is at 1.0850, trending upward for two weeks. Then it hits resistance at 1.0950 and drops to support at 1.0800. It bounces back to 1.0950, drops again to 1.0800. That's two touches on each level. You've got a rectangle.
How to Trade Rectangle Pattern Breakouts
There are two main approaches to rectangle pattern trading. Let's break them down with real numbers.

Approach 1: Buy at Support, Sell at Resistance (Range Trading)
This works best when the rectangle is wide enough to cover transaction costs. For EUR/USD, if the rectangle is 150 pips tall (1.0800 to 1.0950), you can buy near 1.0810 (10 pips above support to avoid false lows) with a stop at 1.0790 (20 pips below support). Target: 1.0930 (20 pips below resistance). Risk: 20 pips. Reward: 120 pips. Risk:Reward = 1:6.
On the flip side, you can sell near 1.0940 with a stop at 1.0960 and target at 1.0820. Same math.
⚠️ Warning: This approach requires tight monitoring. The rectangle could break out at any time, and if you're caught on the wrong side, the breakout will blow through your stop.
Approach 2: Wait for the Breakout (The Safer Play)
This is the recommended method for most traders. You wait for price to close outside the rectangle with above-average volume. Then you enter in the direction of the breakout.
Here's the math for a bullish breakout on EUR/USD:
- Rectangle: Support at 1.0800, Resistance at 1.0950. Height = 150 pips.
- Breakout: Price closes above 1.0950 on high volume.
- Entry: 1.0955 (5 pips above resistance to confirm).
- Stop loss: 1.0930 (20 pips below resistance — gives it room).
- Target: 1.0950 + 150 pips = 1.1100.
- Risk: 25 pips. Reward: 145 pips. Risk:Reward = 1:5.8.
For a bearish breakout, reverse the math. Entry below support, stop above support, target = support minus the rectangle's height.
Bullish Rectangle vs. Bearish Rectangle: Side-by-Side Comparison
| Feature | Bullish Rectangle | Bearish Rectangle |
|---|---|---|
| Prior trend | Uptrend | Downtrend |
| Breakout direction | Upward (above resistance) | Downward (below support) |
| Entry | Above resistance after breakout | Below support after breakdown |
| Stop loss | Below resistance (20-30 pips) | Above support (20-30 pips) |
| Target | Resistance + rectangle height | Support - rectangle height |
| Volume confirmation | Volume spike on breakout | Volume spike on breakdown |
The Measuring Principle: How to Set Your Price Target
The measuring principle is simple: the height of the rectangle tells you how far price is likely to move after the breakout. This works for both bullish and bearish breakouts.
Let's use a real example with Gold (XAU/USD) since that's my specialty:
- Rectangle: Support at $2,350, Resistance at $2,400. Height = $50.
- Bullish breakout: Price closes above $2,400. Target = $2,400 + $50 = $2,450.
- Bearish breakdown: Price closes below $2,350. Target = $2,350 - $50 = $2,300.
On a 0.1 lot Gold trade (10 ounces), that $50 move equals $500 profit or loss. On a 1.0 lot (100 ounces), it's $5,000. The measuring principle gives you a concrete target to aim for — and helps you hold through the noise.
One important note: the measuring principle gives you a minimum target, not a maximum. Price can (and often does) move further than the projection. But it's a reliable benchmark for taking partial profits.
Common Mistakes in Rectangle Pattern Trading
Let's look at the wrong way first — then the right way.
Wrong Way: You see a rectangle forming on GBP/USD. It's been bouncing between 1.2600 and 1.2750 for a week. You decide to buy at 1.2620, expecting a bounce to resistance. But price breaks below 1.2600 on low volume, and you hold because "it might come back." It doesn't. You lose $200 on 0.1 lots as price drops to 1.2500.
Right Way: You wait for the breakout. Price closes below 1.2600 on high volume. You enter short at 1.2595 with a stop at 1.2620 (25 pips risk). Target: 1.2600 - 150 pips (rectangle height) = 1.2450. Risk: 25 pips. Reward: 125 pips. You take the trade and the data supports it — breakouts with volume confirmation work more often than not.
The lesson: patience beats guessing every time. Let the market tell you where it's going.
FAQ
How do I confirm a rectangle pattern breakout?
Look for a close outside the rectangle (above resistance or below support) with above-average volume. A spike in volume confirms that large players are participating in the breakout, making it more likely to sustain.

What's the difference between a rectangle and a channel?
Rectangles have horizontal support and resistance lines, indicating sideways consolidation with no trend. Channels are sloped up or down, representing a trending market where price oscillates within a defined range.
Can rectangle patterns fail?
Yes. False breakouts happen when price briefly moves outside the rectangle but quickly reverses back inside. To reduce risk, wait for a close outside the pattern before entering, and always use a stop loss.
What time frame works best for rectangle pattern trading?
Rectangles work on all time frames, but the most reliable ones form on the 1-hour to daily charts. Higher time frames produce fewer false breakouts. Scalpers can trade them on 15-minute charts, but expect more noise.
📝 Quick Recap
- A rectangle pattern forms when price moves between parallel support and resistance levels.
- It signals consolidation — buyers and sellers are evenly matched.
- 67% of rectangles are continuation patterns; trade in the direction of the prior trend.
- Use the measuring principle: project the rectangle's height from the breakout level to set your target.
- Wait for a close outside the rectangle with volume confirmation before entering.
Quick Win: Find One Rectangle on Your Chart Today
Open your trading platform right now. Pull up EUR/USD on the 4-hour chart. Scroll back over the last two weeks. Look for two parallel horizontal lines where price bounced at least twice on each level. Found one? That's your rectangle. Mark the support and resistance lines. Measure the height. Now you know where the next big move is likely to go when it breaks. Start practicing — you'll spot them everywhere.


