
You've Been Told to "Trade the Trend." Here's Why That's Only Half the Story.
Let's be real. Most forex advice screams at you to "always trade with the trend." But what happens when the market just... sits there? Moving sideways for days. Bouncing between the same two prices like a ping-pong ball.
If you only know how to trade trends, you're sitting on your hands during these periods. Watching price go nowhere. Maybe even losing money because you're forcing trades that aren't there.
That's where the range trading strategy comes in. It's the playbook for sideways markets. And if you master it, you can actually profit while everyone else is waiting for a breakout that never comes.
I've been trading these setups for over a decade. Let me show you exactly how it works — with real numbers, real mistakes, and a step-by-step plan you can use today.
What Is a Range Trading Strategy? (The Simple Explanation)
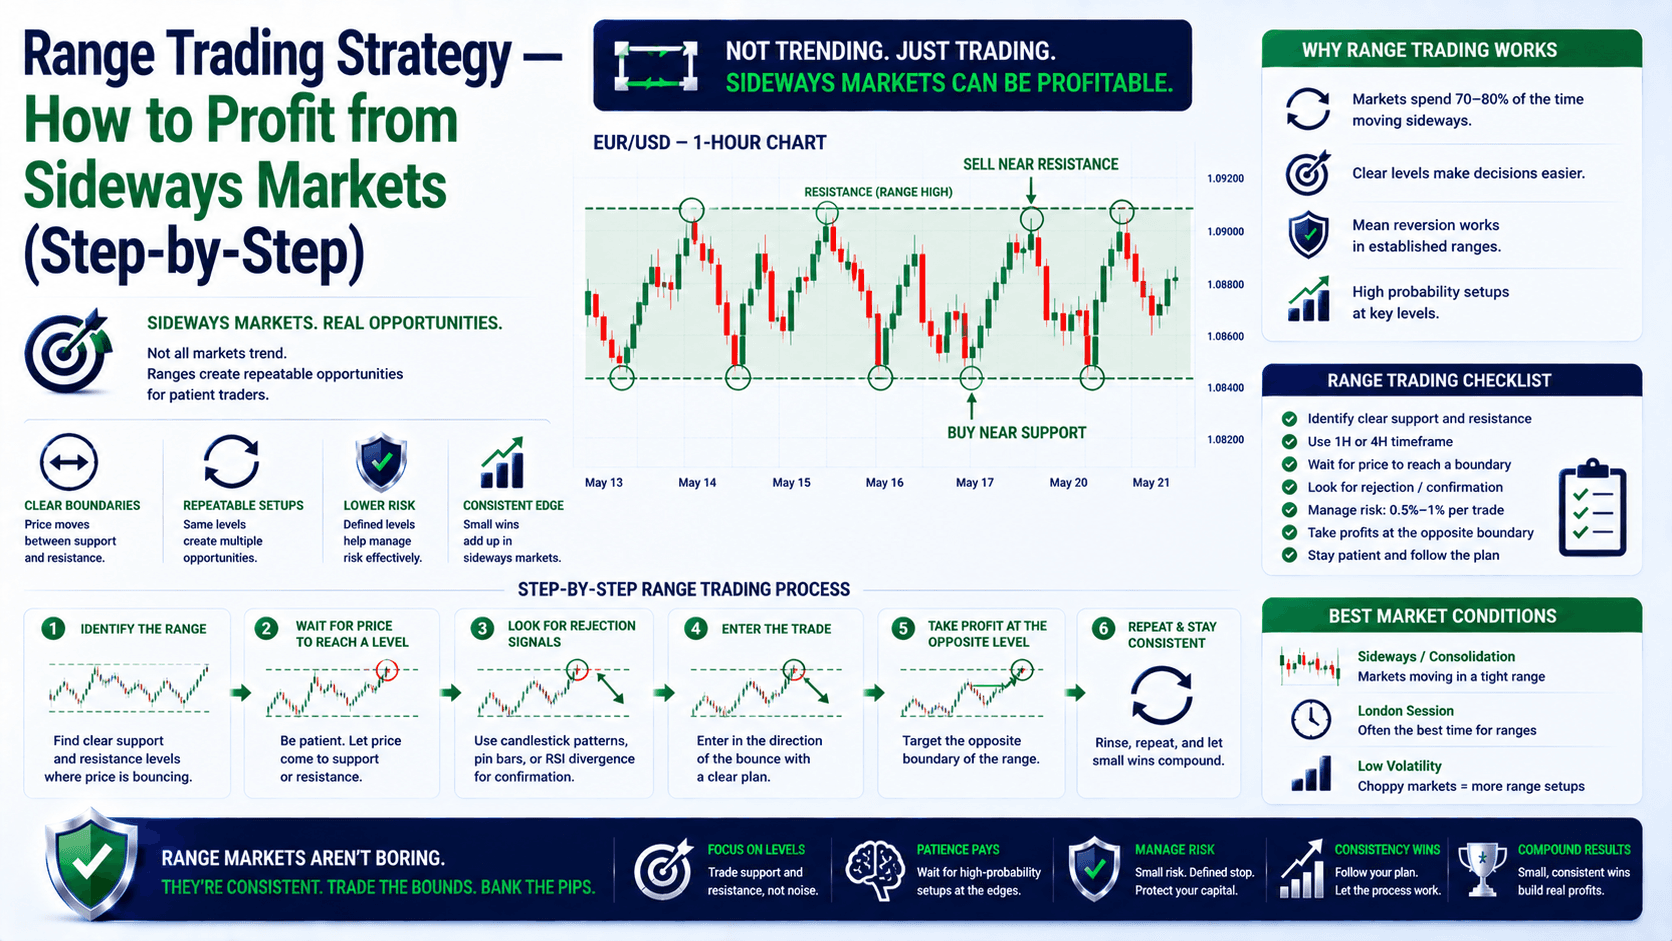
A range trading strategy is exactly what it sounds like: you identify a price range where an asset keeps bouncing between a high and a low, and you trade the bounces.
Think of it like a room with a ceiling and a floor. Price bounces off the floor (support), hits the ceiling (resistance), then comes back down. Over and over.
Here's the wrong way beginners do it:
- They see EUR/USD at 1.0850, think "it's low, I'll buy" — no plan, no levels.
- Price drops to 1.0820. They panic and sell at a loss.
- Price then bounces to 1.0880. They chase it, buy high, and get stopped out again.
Sound familiar? That's not a strategy. That's gambling.
Here's the right way:
- Identify clear support at 1.0820 and resistance at 1.0880.
- Buy at 1.0825 with a stop at 1.0800 (20 pips risk).
- Sell at 1.0875 with a target of 1.0825 (50 pips profit).
- Repeat until the range breaks.
That's a range trading strategy in action. Simple? Yes. Easy? Not always — but we'll fix that.
Support and Resistance — The Two Lines That Define Your Range
Every range has two critical levels: support (the floor) and resistance (the ceiling). You need to find them before you place a single trade.

How to Identify Support and Resistance in a Range
Open your chart. Look for price levels where the market has reversed at least twice. Here's how:
- Find the lows: Look for 2-3 points where price bounced up. Draw a horizontal line at the lowest of these points. That's your support.
- Find the highs: Look for 2-3 points where price was rejected downward. Draw a horizontal line at the highest of these points. That's your resistance.
- Check your timeframe: For a reliable range, use the 1-hour or 4-hour chart. These levels hold longer.
Pro tip: Don't draw the line at the exact wick. Give it 5-10 pips of breathing room. Price will often spike a few pips past support before bouncing. If your line is too tight, you'll miss the trade.
The 3-Step Range Trading Strategy Setup
Here's exactly how I set up a range trade. Follow these steps in order.
Step 1: Confirm the Market Is in a Range
Not every sideways market is a range. Sometimes it's just a pause before a big move. Here's how to check:
- Look at the chart: Is price bouncing between two clear levels at least 3 times? If yes, you have a range.
- Check the RSI: The Relative Strength Index (RSI) should hit overbought (above 70) near resistance and oversold (below 30) near support. This confirms the range is holding.
- Watch volume: If volume is declining as price approaches support or resistance, the range is likely to hold. If volume is spiking, a breakout might be coming.
Common mistake at this step: Jumping in too early. Wait for at least 2 touches on both support and resistance before calling it a range.
Step 2: Plan Your Entry, Stop, and Target
Let's use a real example. EUR/USD is trading in a range between 1.0820 (support) and 1.0880 (resistance).
For a BUY trade at support:
- Entry: 1.0825 (5 pips above support to avoid the spike)
- Stop Loss: 1.0800 (20 pips below support)
- Target: 1.0875 (50 pips — just below resistance)
- Risk: 20 pips × $1/pip (0.1 lots) = $20
- Reward: 50 pips × $1/pip = $50
- Risk:Reward: 1:2.5
For a SELL trade at resistance:
- Entry: 1.0875 (5 pips below resistance)
- Stop Loss: 1.0900 (25 pips above resistance)
- Target: 1.0825 (50 pips — just above support)
- Risk: 25 pips × $1/pip = $25
- Reward: 50 pips × $1/pip = $50
- Risk:Reward: 1:2
Step 3: Manage the Trade
Once you're in, don't just sit there. Here's what to do:
- If price moves in your favor: Move your stop loss to breakeven once you're 20 pips in profit. This guarantees you don't lose money.
- If price stalls near the middle of the range: Close half the position manually. The middle is dead zone — no momentum.
- If price breaks support or resistance: Close the trade immediately. The range is dead. Don't hope for a reversal.
Range Trading vs. Trend Trading — Which One Should You Use?
Here's a quick comparison to help you decide:
| Factor | Range Trading | Trend Trading |
|---|---|---|
| Market condition | Sideways / choppy | Strong directional move |
| Entry style | Buy low, sell high | Buy high, sell higher (or vice versa) |
| Stop loss placement | Just outside the range | Below recent swing low / above swing high |
| Risk per trade | Typically smaller (tight range) | Can be larger (wide swings) |
| Win rate | Higher (price bounces predictably) | Lower (trends can reverse suddenly) |
| Best for | Beginners and scalpers | Intermediate to advanced traders |
| Time commitment | Active monitoring needed | Can hold for days or weeks |
Bottom line: Use range trading when the market is quiet and consolidating. Switch to trend trading when a breakout happens. Don't force one strategy on every market condition.
The #1 Mistake Beginners Make (And How to Avoid It)
Here's the trap: You identify a perfect range. You buy at support. Price bounces to resistance. You sell. It works three times in a row. You feel invincible.
Then on the fourth trade, price breaks through support. You're holding a losing position. You think "it'll bounce back" — but it doesn't. You lose $200 on a single trade.
Here's the fix:
- Always use a stop loss. No exceptions. Even if you're "sure" the range will hold.
- Watch for volume spikes. If volume surges near support or resistance, a breakout is likely. Get out of your trade.
- Don't trade the range's edges too aggressively. If the range is narrowing (price is making lower highs and higher lows), a breakout is coming. Wait for it.
Your action item: Before your next range trade, write down your stop loss level on a sticky note and put it on your monitor. If price hits it, you close. No hesitation.
FAQ
Is range trading profitable?
Yes — if you follow the rules. The key is to have a positive risk:reward ratio (at least 1:2) and a high win rate (60%+). With proper risk management, it's a consistent strategy.

What timeframes work best for range trading?
The 1-hour and 4-hour charts are ideal for most traders. They give you enough price action to identify clear support and resistance without being too noisy. Scalpers can use the 15-minute chart, but ranges break more often on lower timeframes.
How do I know when a range is about to break?
Watch for three signs: (1) price starts making lower highs and higher lows (narrowing range), (2) volume increases significantly near support or resistance, and (3) the RSI stops hitting overbought/oversold levels. When you see these, prepare for a breakout.
Can I use a range trading strategy on any asset?
Yes. Range trading works on forex pairs, stocks, commodities, and indices. The key is finding assets with clear support and resistance levels. Major forex pairs like EUR/USD and GBP/USD are great because they often trade in well-defined ranges.
Quick Recap
- Range trading strategy works in sideways markets — buy at support, sell at resistance.
- Identify support and resistance using at least 2 touches on each level.
- Always use a stop loss just outside the range.
- Target a risk:reward ratio of at least 1:2.
- Watch for volume spikes — they signal a potential breakout.
- Don't trade the range if it's narrowing. Wait for the breakout.
Your Quick Win (Do This Now)
Open your trading platform. Pull up EUR/USD on the 1-hour chart. Scroll back over the last 48 hours. Find a price level where price bounced at least 3 times. Draw a horizontal line there. Now find the opposite level where price was rejected 3 times. Draw another line.
You just identified a range. Now set an alert at both levels. When price touches support, you'll be ready to buy. When it touches resistance, you'll be ready to sell.
That's your first range trade setup. No guesswork. Just a plan.


