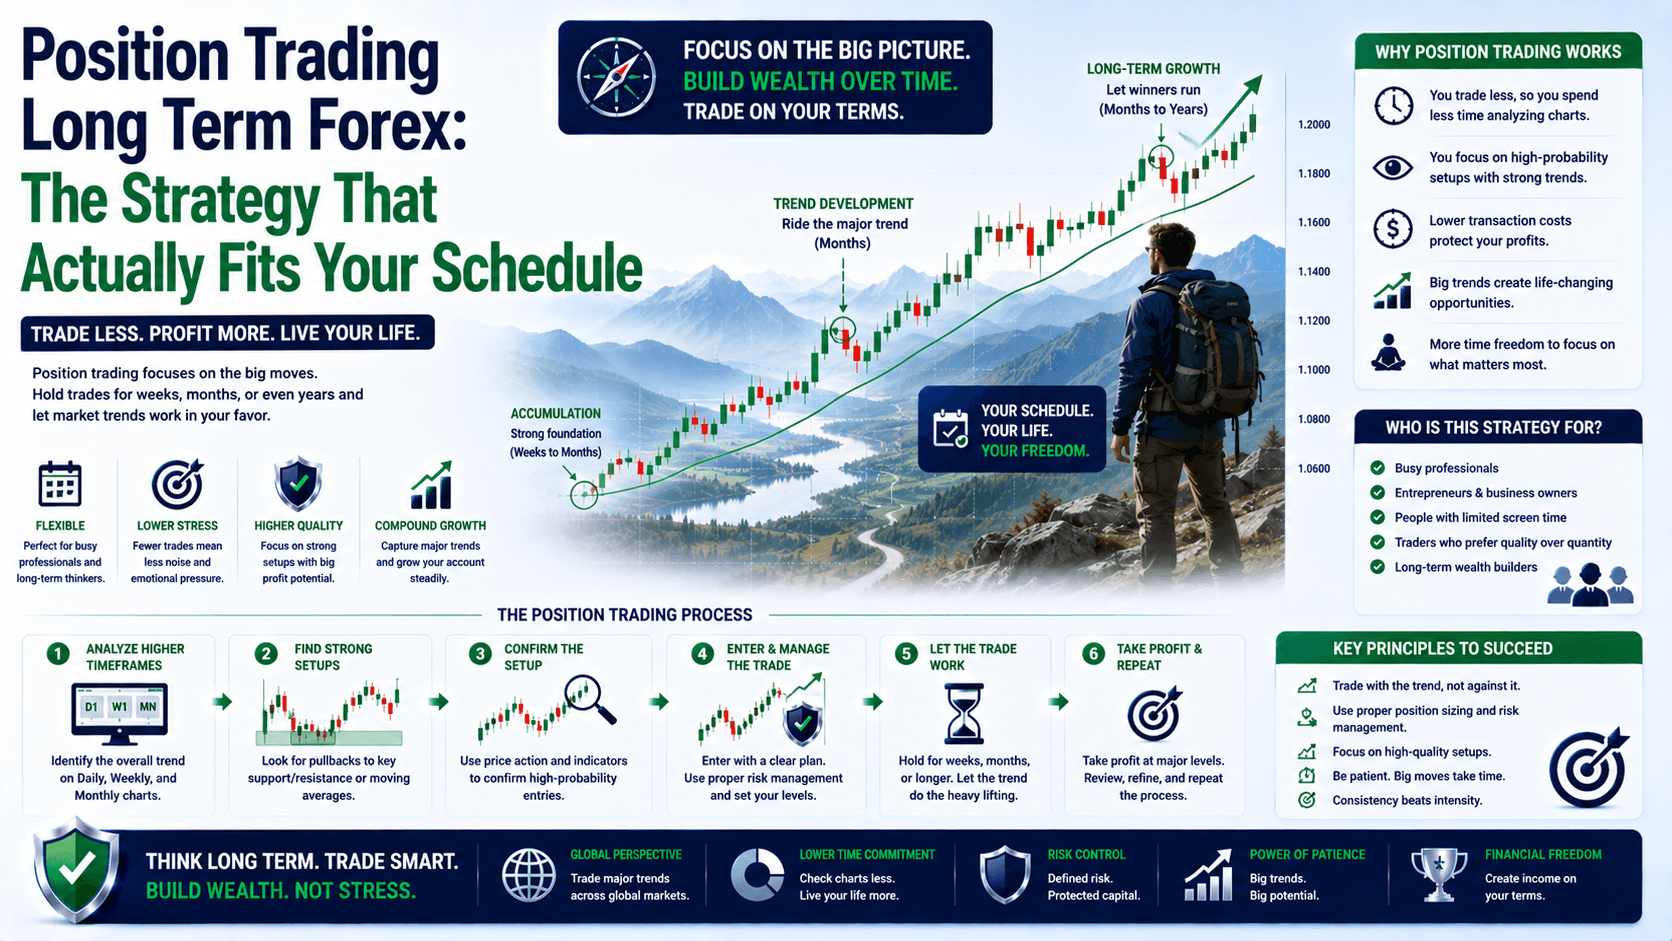

What Is Position Trading Long Term Forex?
Position trading long term forex is a strategy where you hold trades for weeks, months, or even years. The goal? Capture major market trends — not the daily noise that drives most traders crazy.
Let me paint a picture. It's Tuesday morning. You're at your day job. Your phone buzzes — it's a price alert. You glance at the chart, nod, and go back to work. No panic. No screen-staring. Just a calm check-in.
That's the position trading life.
Here's the deal: Most beginners jump into scalping or day trading because they think that's "real trading." They stare at 1-minute charts, take 50 trades a day, and burn out in 3 months. Meanwhile, position traders are sitting on a single EUR/USD trade that's been running for 6 weeks, up 800 pips.
Who wins in the long run? The one who doesn't quit.
And position trading long term forex is how you survive long enough to actually profit.
Why Most Traders Get This Wrong
The biggest mistake I see? People treat position trading like day trading with a longer hold time. They check their charts every 15 minutes. They tweak their stop loss daily. They panic when price drops 50 pips on a Monday.
Here's the truth: If you're checking your position trade every day, you're doing it wrong.
Let me show you what I mean with a real example:
The Wrong Way:
You go long EUR/USD at 1.0850 with a target of 1.1200 (350 pips). On day 3, price drops to 1.0800. You panic, close the trade at a 50-pip loss. Two weeks later, EUR/USD hits 1.1200. You missed 350 pips because you couldn't sit through a 50-pip drawdown.
The Right Way:
Same entry at 1.0850. You set your stop at 1.0750 (100 pips — wide enough for the noise). You set your target at 1.1200. Then you walk away. You check it once a week. Price drops to 1.0800? No problem. Your stop is 50 pips below. Price bounces, trends up, and 6 weeks later you're up 350 pips.
See the difference? The strategy is the same. The psychology is completely different.
The 3 Pillars of Position Trading Long Term Forex
1. Trend Identification on Higher Timeframes
You don't trade position strategies on 15-minute charts. Period.
Pull up the weekly chart. That's your main timeframe. The daily chart is for fine-tuning entries. The 4-hour? Only for finding a good entry within the bigger move.
Here's a simple process:
- Open the weekly chart of EUR/USD
- Look at the last 20-30 weekly candles
- Are they making higher highs and higher lows? → Uptrend
- Lower highs and lower lows? → Downtrend
- Sideways? → Don't trade. Wait.
That's it. You don't need 15 indicators. Just price structure on a weekly chart.
2. Fundamental Analysis as Your Compass
Position trading long term forex isn't about chart patterns alone. You need to understand why a currency is moving.
The big drivers:
- Interest rates — Higher rates attract capital. If the Fed is hiking and the ECB is cutting, USD will strengthen over time.
- GDP growth — A growing economy attracts investment.
- Inflation — Persistent inflation forces central banks to act.
- Geopolitical events — Wars, elections, trade deals.
Example: In early 2025, the Fed signals it's pausing rate hikes while the ECB signals more tightening. You go long EUR/USD. Your thesis: the rate gap is closing. You hold for 3 months. EUR/USD moves from 1.0850 to 1.1150 — 300 pips. That's $3,000 on a 1.0 lot position.
3. Position Sizing for the Long Haul
This is where most position traders fail. They use the same position size they'd use for a day trade — and get stopped out by normal volatility.
The math:
- Account size: $10,000
- Risk per trade: 2% = $200
- Stop loss: 150 pips (wide enough for weekly swings)
- Position size: $200 ÷ 150 pips = $1.33 per pip
- On EUR/USD, 1 standard lot = $10 per pip
- So: $1.33 ÷ $10 = 0.13 lots
You're trading 0.13 lots on a $10,000 account. That feels small. But here's the thing: if you catch a 300-pip move, that's $400 — a 4% gain on your account. Three of those in a year? 12% return. Not bad for checking charts once a week.
Two Proven Position Trading Strategies
Strategy 1: The 50/200 Moving Average Crossover
This is the most reliable long-term trend signal in forex.

Setup:
- 50-day EMA (exponential moving average)
- 200-day EMA
- Daily chart
Rules:
- Buy signal: 50 EMA crosses ABOVE 200 EMA → Go long
- Sell signal: 50 EMA crosses BELOW 200 EMA → Go short
- Exit: When the 50 EMA crosses back the other way
Real example:
On the daily USD/JPY chart in late 2024, the 50 EMA crossed above the 200 EMA at 148.50. You go long. Your stop is 200 pips below at 146.50. Your target? You hold until the cross reverses. The trade runs for 5 months, reaching 155.00 — a 650-pip gain. On 0.1 lots, that's $650. On 1.0 lot, that's $6,500.
Strategy 2: Donchian Channel Breakout
Developed by Richard Donchian, this strategy catches breakouts of major ranges.
Setup:
- Donchian Channel with period 20 on the daily chart
- The channel shows the highest high and lowest low of the last 20 days
Rules:
- Buy signal: Price closes above the 20-day high
- Sell signal: Price closes below the 20-day low
- Exit: When price closes back inside the channel
Why it works for position trading: A breakout above a 20-day range often signals the start of a sustained move. The longer the range, the more powerful the breakout.
Position Trading vs Other Styles: A Comparison
| Trading Style | Hold Time | Check Frequency | Trades per Month | Stress Level |
|---|---|---|---|---|
| Scalping | Seconds to minutes | Constant | 100+ | Very High |
| Day Trading | Minutes to hours | Every few hours | 20-50 | High |
| Swing Trading | Days to weeks | Daily | 5-15 | Moderate |
| Position Trading | Weeks to months | Weekly | 1-3 | Low |
Position trading isn't "better" — it's different. It fits a specific lifestyle. If you have a full-time job, a family, or just don't want to live in front of charts, this is your style.
Risk Management for Long-Term Positions
Here's what changes when you hold trades for months:
1. Swap fees add up. Holding a EUR/USD short for 3 months might cost you $50-100 in overnight swap fees. Factor this into your profit target.
2. Wider stops are necessary. A 30-pip stop works for day trading. For position trading, 100-200 pips is normal. Your position size must shrink accordingly.
3. Drawdowns are psychological. Your trade might be down 5% before it's up 15%. If you can't handle that, position trading isn't for you.
4. Use trailing stops. Once your trade is 100 pips in profit, move your stop to breakeven. Then trail it as price moves in your favor.
Common Mistakes in Position Trading Long Term Forex
I've made every one of these. Don't be me.
- Checking charts too often — You'll talk yourself out of good trades. Check once a day max.
- Taking profits too early — 50 pips on a position trade is nothing. Let it run.
- Using too much leverage — 1:10 or less. Position trades need breathing room.
- Ignoring fundamentals — Technicals tell you when. Fundamentals tell you why.
- Overtrading — One good position trade per month beats 50 bad day trades.
FAQ
What's the minimum capital for position trading forex?
$1,000 is the absolute minimum. But $5,000-$10,000 is more realistic because you need wider stops and lower leverage. With $1,000, you're limited to micro lots and small positions.

Can I position trade with a full-time job?
Yes — that's the whole point. Most position traders have full-time jobs. You check charts once a day or even once a week. No screen-staring required.
What timeframes do position traders use?
Daily, weekly, and monthly charts. The weekly chart shows the main trend. The daily chart helps with entry timing. Never use timeframes below 4-hour for position trading.
Is position trading better than swing trading?
"Better" depends on your lifestyle. Position trading requires less time but more patience. Swing trading needs more attention but has shorter holding periods. Choose based on your schedule, not your ego.
Quick Recap
- Position trading long term forex means holding trades for weeks to months
- Use weekly and daily charts — never 15-minute charts
- Combine technicals (moving averages, Donchian channels) with fundamentals
- Risk 1-2% per trade with 100-200 pip stops
- Check charts once a day max — let the trade breathe
Your Quick Win
Open your chart right now. Pull up EUR/USD on the weekly chart. Look at the last 20 weekly candles. Is it in an uptrend (higher highs, higher lows) or a downtrend (lower highs, lower lows)? Write it down. Then check the 50 and 200 EMA. Are they crossed? If yes — you just identified a potential position trade. If no — wait. That took 3 minutes. You're already ahead of 90% of traders.


