
Why Most Traders Get Pivot Points Wrong
Here's a scenario you've probably lived through. You're watching EUR/USD at 1.0850. The market looks like it's about to bounce. You enter long. Then price drops another 30 pips, hits your stop, and reverses 50 pips higher.
The problem? You had no objective reference for where support actually was. You were guessing.
Pivot points fix that. They give you calculated levels based on the previous day's price action. No guessing. No gut feelings. Just math.
But here's the thing most tutorials don't tell you: pivot points aren't magic. They're probability tools. And if you don't understand the probabilities, you're just drawing lines on a chart.
What Is a Pivot Points Trading Strategy?
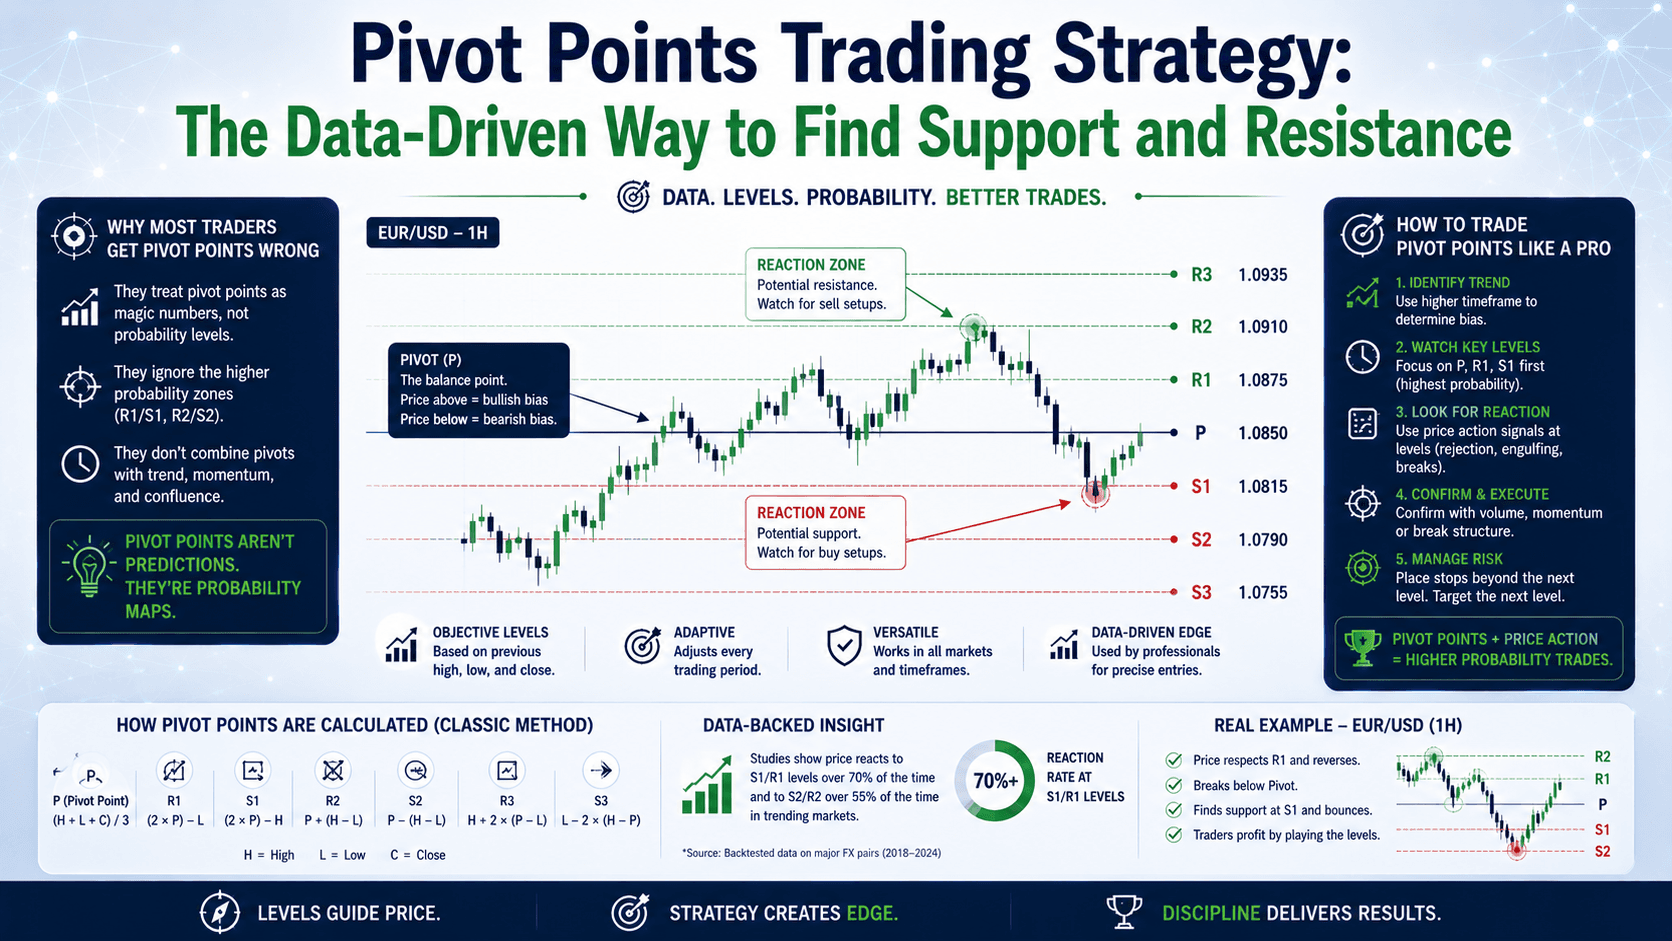
A pivot points trading strategy uses calculated levels from the previous period's high, low, and close to identify potential support and resistance zones. The core idea is simple: yesterday's price behavior influences today's trading decisions.
The pivot point itself is the average of the high, low, and close. It acts as a central reference. If price trades above it, the market is bullish. Below it? Bearish.
But the real value comes from the support and resistance levels derived from that pivot. These are labeled S1, S2, S3 (support) and R1, R2, R3 (resistance).
Let's compare how pivot points stack up against traditional support and resistance:
| Feature | Traditional S/R | Pivot Points |
|---|---|---|
| Calculation method | Subjective (swing highs/lows) | Mathematical formula |
| Objectivity | Low — different traders see different levels | High — same formula gives same levels |
| Timeframe | Any timeframe | Typically daily, weekly, or monthly |
| Adaptability | Recalculated manually | Auto-updates each period |
| Best use case | Long-term trend analysis | Short-term entries and exits |
How to Calculate Pivot Points for Forex
The standard formula uses five points. Here's the math:
Pivot Point (PP) = (High + Low + Close) / 3
Resistance 1 (R1) = (2 × PP) - Low
Support 1 (S1) = (2 × PP) - High
Resistance 2 (R2) = PP + (High - Low)
Support 2 (S2) = PP - (High - Low)
Let's make this concrete. Say yesterday's EUR/USD data was:
- High: 1.0875
- Low: 1.0820
- Close: 1.0850
PP = (1.0875 + 1.0820 + 1.0850) / 3 = 1.0848
R1 = (2 × 1.0848) - 1.0820 = 1.0876
S1 = (2 × 1.0848) - 1.0875 = 1.0821
R2 = 1.0848 + (1.0875 - 1.0820) = 1.0903
S2 = 1.0848 - (1.0875 - 1.0820) = 1.0793
Now you have objective levels for today. If price approaches 1.0876 (R1), you know it's a potential resistance zone. If it drops to 1.0821 (S1), that's a potential support area.
What the Data Says About Pivot Point Accuracy
This is where pivot points trading strategy gets interesting. Data from EUR/USD since the euro's inception shows clear probability patterns:

| Level | Probability Price Reaches Beyond It | Average Distance from Actual High/Low |
|---|---|---|
| R1 | 42% of days | 1 pip below R1 |
| S1 | 44% of days | 1 pip below S1 |
| R2 | 17% of days | 53 pips below R2 |
| S2 | 17% of days | 53 pips above S2 |
| R3 | 3% of days | 159 pips below R3 |
| S3 | 3% of days | 158 pips above S3 |
What does this mean for your trading?
R1 and S1 are your high-probability zones. The actual daily high is, on average, just 1 pip below R1. The actual low is 1 pip below S1. This means these levels act as strong magnets for price.
R2 and S2 are moderate-probability zones. Price reaches beyond them only 17% of the time. If you see price approaching R2, expect it to act as resistance — but don't be surprised if it breaks through.
R3 and S3 are extreme levels. Only 3% of days see price move beyond them. If price hits R3, you're looking at a massive move. The average distance is 159 pips below R3 — meaning these levels are rarely reached, but when they are, price tends to overshoot.
Two Pivot Point Trading Strategies That Work
Strategy 1: Range Trading with Pivot Points
This is the bread and butter of pivot points trading strategy. You treat S1 and R1 as your range boundaries.
The setup:
- Price approaches S1. You look for a bullish rejection candle (long lower wick).
- Enter long at market or 1-2 pips above S1.
- Stop loss: 5-10 pips below S1 (or below S2 for a wider stop).
- Take profit: PP or R1.
Let's run the numbers. EUR/USD is at 1.0821 (S1). You enter long at 1.0823 with a stop at 1.0811 (12 pip risk) and target at PP (1.0848).
On 0.1 lots: Risk = $12, Reward = $25. That's a 1:2 risk-reward ratio. On 0.5 lots: Risk = $60, Reward = $125.
The wrong way: Most beginners see S1 and enter immediately without waiting for confirmation. Price touches S1, then drops another 10 pips, taking their stop. The fix? Wait for a rejection candle or a close above S1.
Strategy 2: Pivot Point Breakout
When price breaks through R1 or S1 with conviction, the trend is likely to continue to the next level.
The setup:
- Price breaks above R1 and closes above it on the 1-hour chart.
- Enter long at the close of that candle.
- Stop loss: 10 pips below R1 (now support).
- Take profit: R2.
Example: EUR/USD breaks R1 at 1.0876 and closes at 1.0882. You enter at 1.0882. Stop at 1.0866 (16 pip risk). Target at R2 (1.0903).
On 0.1 lots: Risk = $16, Reward = $21. Not great. But if you let it run to R3? Target = 1.0920 (38 pips). Now you have a 1:2.4 risk-reward.
Combining Pivot Points with RSI Divergence
This is where pivot points trading strategy gets powerful. RSI divergence at a pivot level dramatically increases the probability of a reversal.
For short trades:
- Identify bearish RSI divergence (price makes higher high, RSI makes lower high).
- This divergence occurs at R1 or R2.
- When price closes back below the pivot level, enter short.
- Stop at the recent swing high.
- Target the next pivot level below.
Real example from GBP/USD:
Price rallied to R1 at 1.2854. RSI showed a lower high. Price then closed below R1 at 1.2853. You short at 1.2853 with a stop at 1.2885 (32 pips). Target: PP at 1.2784 (69 pips).
Risk:Reward = 1:2.16. On 0.1 lots: Risk $32, Reward $69.
Common Mistakes in Pivot Point Trading
Mistake 1: Using pivot points on the wrong timeframe. Daily pivot points work best on 1-hour and 15-minute charts. Using them on a 5-minute chart creates too much noise.
Mistake 2: Ignoring the broader trend. If the daily trend is strongly bullish, selling at R1 is a bad idea. Wait for confirmation (like RSI divergence) before trading against the trend.
Mistake 3: Setting stops too tight. The data shows the actual low is, on average, 1 pip below S1. But that's an average. On 44% of days, price goes below S1. Give your stop at least 5-10 pips of breathing room.
Mistake 4: Using pivot points in isolation. Combine them with candlestick patterns, RSI, or moving averages. A doji at S1 is a stronger signal than S1 alone.
FAQ
Are pivot points reliable for forex trading?
Yes, but with caveats. The data shows S1 and R1 act as accurate support/resistance roughly 40-50% of the time. They're most reliable on major pairs like EUR/USD and GBP/USD during active market sessions.

Should I use daily or weekly pivot points?
Use daily pivot points for short-term trading (scalping, day trading) and weekly pivot points for swing trading. Daily pivots are more sensitive to intraday noise; weekly pivots give you a bigger picture.
Can I use pivot points with other indicators?
Absolutely. The best results come from combining pivot points with RSI divergence, candlestick patterns, or moving averages. Pivot points provide the levels; other indicators provide the confirmation.
What's the best time to trade pivot points?
The London and New York sessions overlap (12:00-16:00 UTC) is ideal. This is when volume is highest and pivot levels are most likely to be respected or broken.
Quick Recap
- Pivot points give you calculated support and resistance levels based on the previous period's high, low, and close
- S1 and R1 are high-probability zones — price reaches beyond them only 42-44% of the time
- Combine pivot points with RSI divergence for higher-probability trades
- Use range trading (buy at S1, sell at R1) or breakout trading (follow the break to the next level)
- Always give your stop 5-10 pips of breathing room below S1 or above R1
Quick Win
Open your chart right now. Pull up EUR/USD on the 1-hour timeframe. Add the pivot points indicator (most platforms have it built-in). Find the last 3 times price touched S1 or R1. Did it reverse? Did it break through? Write down what happened. Do this for 10 trading days, and you'll start seeing the patterns yourself.


