
What Exactly Is Parabolic SAR Trading?
Parabolic SAR stands for Stop and Reverse. It's a trend-following indicator developed by J. Welles Wilder Jr. — the same guy who gave us the RSI and ATR.
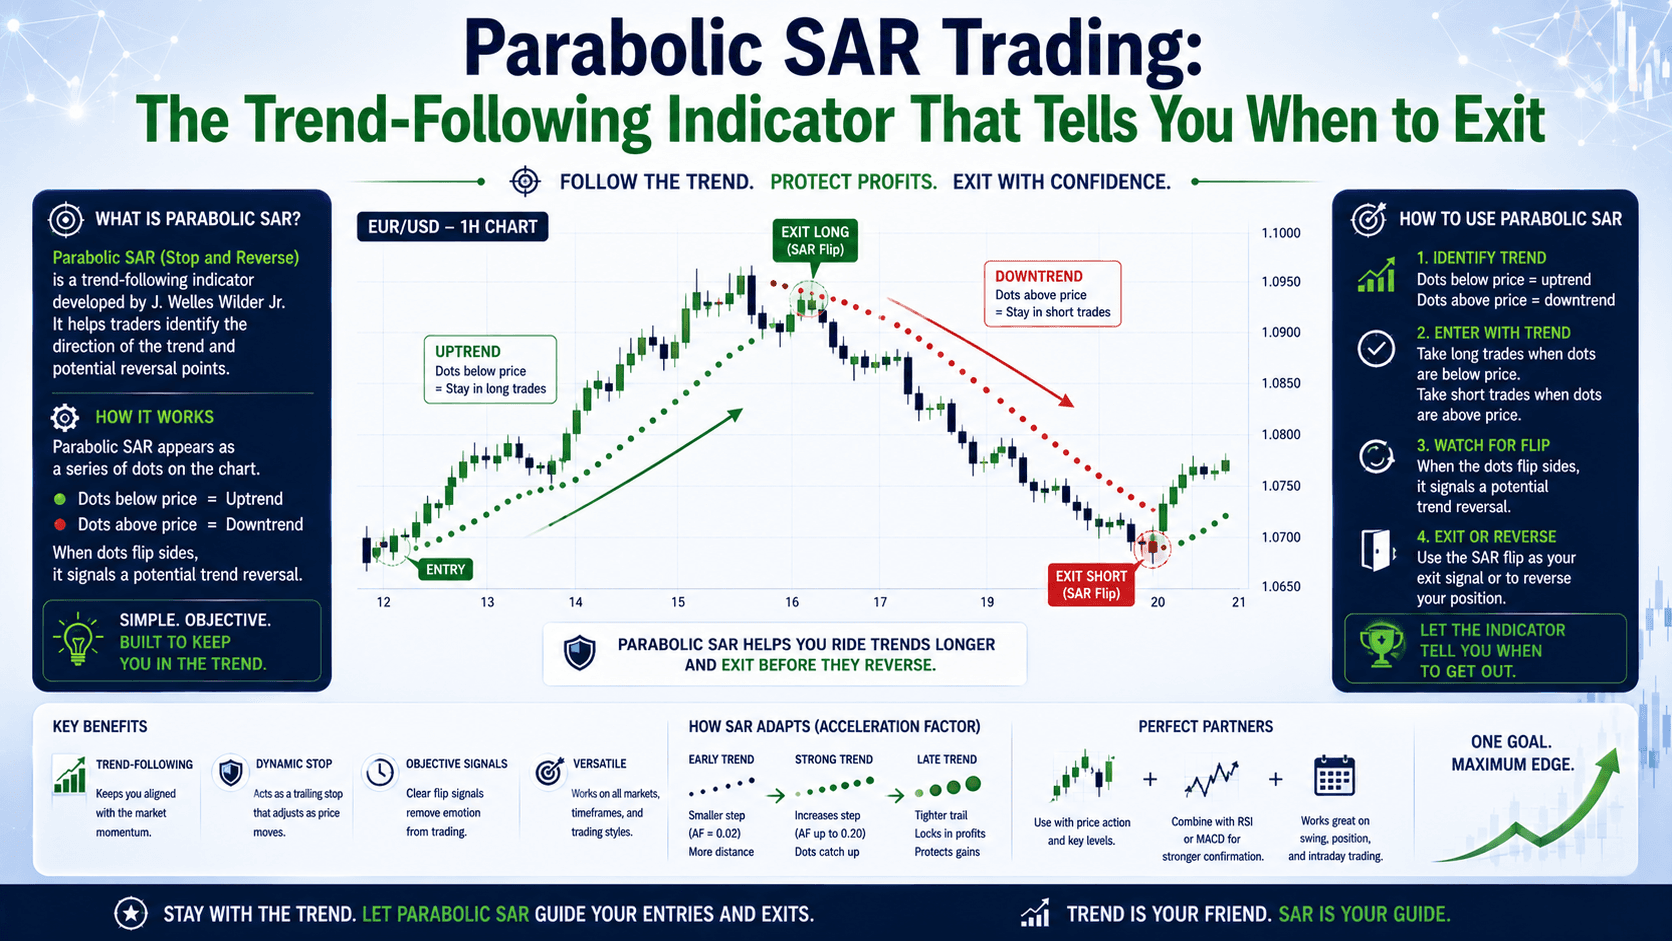
On your chart, it looks like a series of dots placed either above or below the price bars. That's it. No lines, no histograms, no complicated overlays.
Here's the simple logic:
- Dots below price = uptrend (bullish signal)
- Dots above price = downtrend (bearish signal)
When the dots flip from one side to the other, the indicator is telling you the trend might be ending. It's designed to always be in the market — switching from long to short as the trend changes.
Now, here's the trap most beginners fall into: they treat every dot flip as a trade signal. That works great in a strong trend. But in a sideways market? Those dots will flip back and forth constantly, and you'll get chopped up.
How Parabolic SAR Trading Works — The Math Behind the Dots
Understanding the formula helps you use the indicator better. The calculation uses three components:
- Previous SAR Value — The last calculated SAR dot
- Extreme Point (EP) — The highest high in an uptrend, or the lowest low in a downtrend
- Acceleration Factor (AF) — Starts at 0.02, increases by 0.02 each time a new EP is reached, capped at 0.20
The formula for an uptrend:
PSAR = Prior PSAR + Prior AF × (Prior EP - Prior PSAR)
For a downtrend:
PSAR = Prior PSAR - Prior AF × (Prior PSAR - Prior EP)
What does this mean in practice? As the trend strengthens, the AF increases, which pulls the dots closer to the price. This makes the indicator more sensitive to potential reversals. When the price finally breaks through the dots, the flip happens.
| Parameter | Default | What It Controls |
|---|---|---|
| Step (AF increment) | 0.02 | How fast SAR moves toward price as trend strengthens |
| Maximum AF | 0.20 | Upper limit to prevent oversensitivity |
Beginners: Leave these at default. Advanced traders: You can tweak them — but only after extensive backtesting.
Parabolic SAR Trading Strategy — The Trend Filter Approach
The biggest mistake traders make with Parabolic SAR is using it in choppy, sideways markets. The indicator gives false signals constantly when there's no clear trend.

Here's a simple strategy that filters out most of the noise:
Step 1: Identify the trend direction
Add a 100-period Simple Moving Average (SMA) to your chart. This is your trend filter.
- Price above 100 SMA = bullish bias
- Price below 100 SMA = bearish bias
Step 2: Wait for the SAR flip
Only take signals in the direction of the SMA filter.
- Buy signal: Dots flip from above to below price + price is above the 100 SMA
- Sell signal: Dots flip from below to above price + price is below the 100 SMA
Step 3: Set your stop loss
Place your stop loss slightly below the recent swing low (for buys) or above the recent swing high (for sells). Don't use the SAR dot itself as your stop — it's too tight and will get hit by normal noise.
Real Trade Example
Let's say EUR/USD is at 1.0850. The 100 SMA is at 1.0800. Price is above it — bullish bias confirmed.
The SAR dots have been above price for the last 12 candles. Suddenly, on the 1-hour chart, a candle closes above the dots. The dots flip below.
Your trade:
- Entry: 1.0855 (just above the flip candle)
- Stop loss: 1.0820 (35 pips below entry, below the recent swing low)
- Target: 1.0920 (65 pips — risk:reward of roughly 1:2)
- Lot size: 0.1 lots
- Risk: 35 pips × $1/pip = $35
- Potential profit: 65 pips × $1/pip = $65
As the trend continues, the SAR dots move higher. You can trail your stop loss behind them, locking in profit as price moves in your favor.
Parabolic SAR vs. Moving Averages — Which Works Better for Trend Trading?
| Feature | Parabolic SAR | Moving Average (50/200 EMA) |
|---|---|---|
| Signal type | Dots flip above/below price | Price crosses above/below MA |
| Lag | Low (adapts quickly to price) | Higher (especially with longer periods) |
| Best market | Strong trending markets | Trending markets with pullbacks |
| Worst market | Sideways / choppy | Sideways / choppy |
| Trailing stop use | Excellent — dots act as dynamic stops | Moderate — requires manual calculation |
| False signals | High in range-bound markets | Moderate in range-bound markets |
The data suggests Parabolic SAR is better for trailing stops and quick exits, while moving averages are better for identifying the overall trend direction. Using them together gives you a stronger framework.
The Wrong Way vs. The Right Way to Use Parabolic SAR
The wrong way: You see dots flip below price on EUR/USD. You buy immediately. Price was in a 20-pip range for the last hour. The dots flip back above 15 minutes later. You're stopped out for a loss. This happens 4 times in a row.
The right way: You check the 1-hour chart first. Price is above the 100 SMA — trending up. The SAR dots flip below. You wait for the next candle to close above the flip to confirm. You enter with a stop below the swing low. The trend continues for 80 pips. You trail your stop using the SAR dots. You exit when the dots flip above, locking in 55 pips of profit.
The difference? Context. The wrong way uses Parabolic SAR in isolation. The right way uses a trend filter and confirmation.
Pros and Cons of Parabolic SAR Trading
Pros:
- Clear visual signals — dots are easy to read at a glance
- Excellent for trailing stops — the dynamic nature locks in profit
- Works beautifully in strong trending markets
- Simple enough for beginners to understand
Cons:
- Useless in sideways markets — expect constant false signals
- Lagging by nature — it reacts to price, not predicts it
- Can be too sensitive in volatile markets with wide swings
- Best used with other indicators for confirmation
FAQ
What is the best timeframe for Parabolic SAR trading?
The 1-hour and 4-hour timeframes work best for most traders. Shorter timeframes like 5-minute or 15-minute produce too many false signals in choppy markets.

Can I use Parabolic SAR for scalping?
It's not ideal. Scalping requires fast entries and exits, and Parabolic SAR's lagging nature can cause you to enter too late. Moving averages or momentum oscillators are better for scalping.
Does Parabolic SAR work on all currency pairs?
Yes, but it works best on pairs with strong trending characteristics like GBP/USD, USD/JPY, and Gold (XAU/USD). Avoid using it on pairs that range frequently like EUR/CHF.
What indicators combine well with Parabolic SAR?
The ADX (Average Directional Index) is the best companion. ADX measures trend strength — above 25 means a strong trend, which is exactly when Parabolic SAR performs best. Moving averages for trend direction are also effective.
📝 Quick Recap
- Parabolic SAR shows trend direction with dots above (bearish) or below (bullish) price
- Use a 100 SMA as a trend filter to avoid false signals in sideways markets
- Never rely on SAR alone — combine with ADX or another trend strength indicator
- Use SAR dots as trailing stops, not as your primary entry signal
- Default settings (Step 0.02, Max 0.20) work best for most traders
Quick Win
Open your chart right now. Pull up EUR/USD on the 1-hour timeframe. Add the Parabolic SAR indicator with default settings. Add a 100-period SMA. Scroll back through the last 2 weeks. Find 3 instances where the SAR flip aligned with price being on the correct side of the SMA. Mark those as valid signals. Now find 3 instances where the SAR flipped while price was near the SMA — those are the false signals you should avoid. That's the difference between a winning setup and a losing trade.


