
Order Blocks Trading Explained — What Are They Really?
You look at a chart. Price is moving sideways for hours. Then suddenly — boom — a massive candle takes price 50 pips in one direction. What happened?
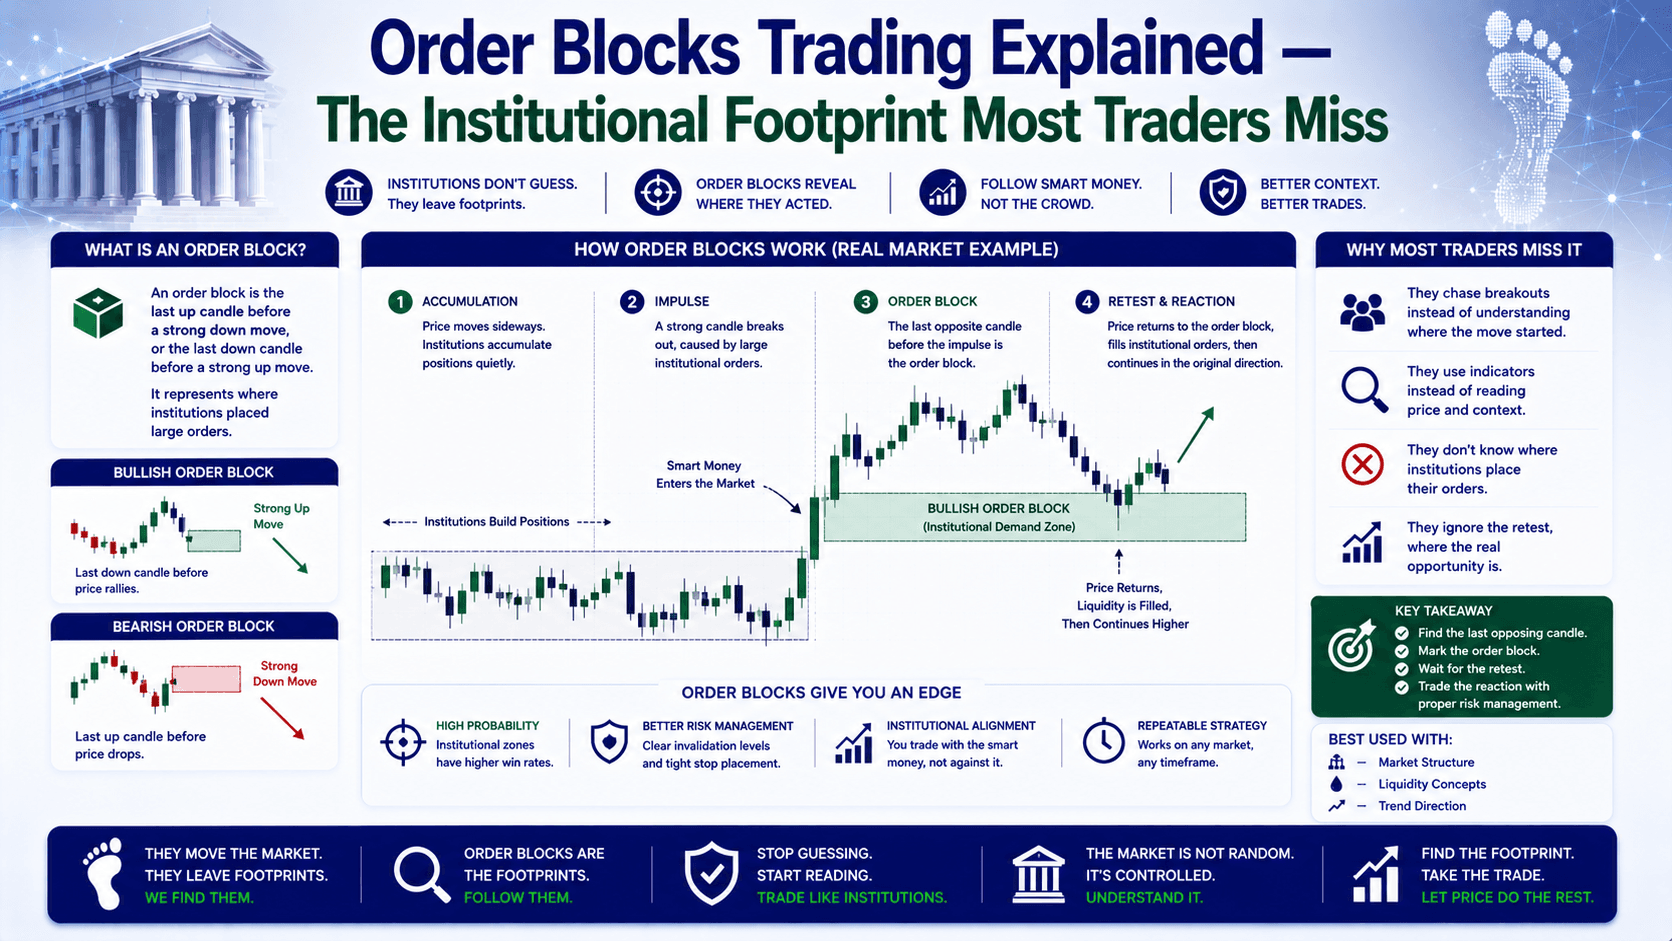
That area where price consolidated before the explosion? That's an order block. And understanding it changes how you see the market.
Let's compare how most traders approach this vs. what's actually happening:
| What Most Traders Think | What's Actually Happening |
|---|---|
| Random volatility spike | Institutional orders being filled |
| Market is unpredictable | Large players are hiding their hand |
| Missed the move — too late | Price will likely return to test that zone |
An order block is a price zone where institutional traders (banks, hedge funds, market makers) placed large orders. They can't dump 1,000 lots at once — it would move the market against them. So they split their orders into smaller chunks. Those chunks create a visible footprint on your chart.
Here's the kicker: price usually returns to these zones. And when it does, it reacts. That's your opportunity.
How to Spot an Order Block — The 3-Step Framework
You don't need fancy indicators. You need your eyes and a clear process.
Step 1: Find the Impulsive Move
Look for a candle that breaks structure — a clean, strong move that leaves nearby highs or lows behind. On EUR/USD, that might be a 30-pip candle that breaks above the last 10 candles' highs.
Step 2: Look Back at the Last Candle Before the Move
This is critical. For a bullish order block, you look at the last bearish candle before the price shot up. For a bearish order block, you look at the last bullish candle before the price dropped.
Step 3: Draw Your Zone
For a bullish order block: draw from the low to the high of that last bearish candle.
For a bearish order block: draw from the high to the low of that last bullish candle.
That zone is your order block.
Bullish vs Bearish Order Blocks — The Wrong Way vs The Right Way
Let me show you the mistake 90% of beginners make.
The wrong way: You see price drop to a level. You think "looks like support." You buy. Price goes straight through and you lose $50 on a 0.1 lot.
The right way: You wait for a clear impulsive move UP from a consolidation zone. You identify the last bearish candle in that zone. You mark your order block. Price retraces to that zone. You wait for a reaction — a rejection candle or a bullish engulfing pattern. Then you enter.
Let's put numbers on this:
| Scenario | Entry | Stop Loss | Target | Risk per 0.1 Lot | Reward per 0.1 Lot |
|---|---|---|---|---|---|
| Wrong (chasing support) | 1.0820 | 1.0800 | 1.0850 | $20 | $30 |
| Right (order block bounce) | 1.0820 | 1.0805 | 1.0860 | $15 | $40 |
Same entry price. But the right setup gives you a tighter stop (because you know where the institutional orders are) and a better target. Risk:reward improves from 1:1.5 to nearly 1:3.
Types of Order Blocks — Not All Zones Are Equal
You'll see different flavors on your chart. Here's how they stack up:

| Type | What It Looks Like | Reliability | Best Used For |
|---|---|---|---|
| Standard | Consolidation → impulsive move | High | Trend continuation entries |
| Breaker | Price breaks through an old OB, then returns | Medium-High | Reversal entries after false breakout |
| Rejection | Long wick into the zone, immediate bounce | Medium | Scalping quick bounces |
| Vacuum | Gap or fast move with no trading in between | Low-Medium | Only if price returns with volume |
Breaker Blocks — When Support Becomes Resistance
A breaker block forms when price breaks through an existing order block instead of respecting it. The zone flips. What was support becomes resistance (or vice versa).
Example: EUR/USD has a bearish order block at 1.0850-1.0860. Price breaks above it. Later, price returns to 1.0850-1.0860. Now that zone acts as support — the opposite of what it was before.
Rejection Blocks — Failed Moves Tell You Something
Sometimes price dips into an order block, leaves a long wick, and bounces hard. That's a rejection block. It means the institutional orders at that level are still active.
Vacuum Blocks — The Gap That Gets Filled
A vacuum block is a zone where price moved so fast that almost no trading happened. It's like a hole in the chart. Price often returns to fill that gap — but the reaction can be unpredictable.
How to Validate an Order Block — 4 Tests
Not every zone is worth your money. Run these checks:
- Did price move away cleanly? If the move was choppy, the OB is weak.
- Has the zone been tested before? A fresh OB is stronger than one that's been touched multiple times.
- Is there a market structure shift? Did price break a swing high/low before forming the OB?
- Does the retest show rejection? A doji, hammer, or engulfing candle at the zone is a good sign.
If 3 out of 4 checks pass, the zone is worth watching.
Order Block Trading Strategy — Simple Rules for Entry, Stop, and Target
Here's a straightforward approach that works across timeframes:
Entry Rules
- Identify the order block on H4 or Daily timeframe (higher = more reliable)
- Wait for price to retrace to the zone
- Look for a rejection candle on the M15 or H1 chart
- Enter on the close of the rejection candle
Stop Loss Placement
- Place stop 5-10 pips beyond the order block boundary
- For bullish OB: stop below the low of the zone
- For bearish OB: stop above the high of the zone
- Risk no more than 1-2% of your account
Target Setting
- First target: the most recent swing high/low before the OB formed
- Second target: 1.5x to 2x your risk
- Move stop to breakeven after first target is hit
Let's run a real example. Gold (XAU/USD) at $2,350. You see a bullish order block from $2,340 to $2,345. Price retraces to $2,342. You see a hammer candle. You enter at $2,342. Stop at $2,338 (below the OB low). Target at $2,360 (recent swing high). Risk: $4 per ounce on 0.1 lots = $40. Reward: $18 per ounce = $180. Risk:reward = 1:4.5.
Common Traps — What Nobody Tells You About Order Blocks
Every forex site tells you to "trade with the trend." What they don't tell you about order blocks:
- They fail in ranging markets. In a sideways market, order blocks get broken constantly. Wait for a clear trend.
- Lower timeframes are noisy. An order block on M1 might look great but fail 70% of the time. Stick to H4 and above for your main analysis.
- Price doesn't always retest. Sometimes the move just runs. If price never comes back, you don't trade. That's discipline.
- One OB doesn't make a strategy. Use it with other confluence — market structure, trend direction, volume if available.
FAQ
How do I confirm an order block?
Look for a strong impulsive move after a consolidation zone. Mark the last candle before the move. Wait for price to retest that zone and show a rejection candle (hammer, engulfing, or doji).

What's the difference between an order block and a supply/demand zone?
Supply and demand zones are wider areas of buying or selling pressure. Order blocks are more precise — they focus on the specific candle(s) before the impulsive move. Many traders use supply/demand for context and order blocks for entries.
Do order blocks work in crypto and stocks?
Yes. Order blocks form in any market with enough volume and liquidity. They tend to be clearer in highly liquid markets like forex majors, S&P 500, Bitcoin, and Gold.
What timeframe is best for order block trading?
Higher timeframes (H4, Daily, Weekly) show the most reliable order blocks. Use them for your main analysis. Drop to M15 or H1 for entry timing, but don't trade order blocks on M1 or M5 unless you're scalping with tight risk.
Quick Recap
- Order blocks are price zones where institutional orders were placed before a strong move
- Identify them by finding consolidation → impulsive move → mark the last candle before the move
- Bullish OB = last bearish candle before a rally; Bearish OB = last bullish candle before a drop
- Validate with 4 tests: clean move, fresh zone, structure shift, rejection at retest
- Trade with the trend, use H4+ for analysis, keep risk under 2%
Quick Win — Do This in 5 Minutes
Open your chart right now. Pull up EUR/USD on the H4 timeframe. Scroll back 2-3 days. Find an area where price consolidated for at least 4-5 candles, then made a strong move of 30+ pips. Mark the last candle before that move. That's your order block. Now check if price has retested it yet. If yes — how did it react? If no — put it on your watchlist. You just found a high-probability zone.


