
Oil Prices and Forex Correlation — Why Your Currency Charts Move When Crude Breathes
Let me show you something that cost me $2,400 to learn.
Back in 2022, I was short USD/CAD. The trade looked perfect — technical setup, support levels, the works. Then Russia invaded Ukraine. Oil spiked from $90 to $130 in weeks. My short position got slaughtered because I didn't understand one thing: oil prices and forex correlation isn't a suggestion. It's a direct pipeline.
Here's the reality: oil moves currencies more consistently than most indicators. And 90% of traders ignore it. Let's fix that.
How Oil Prices and Forex Correlation Actually Works
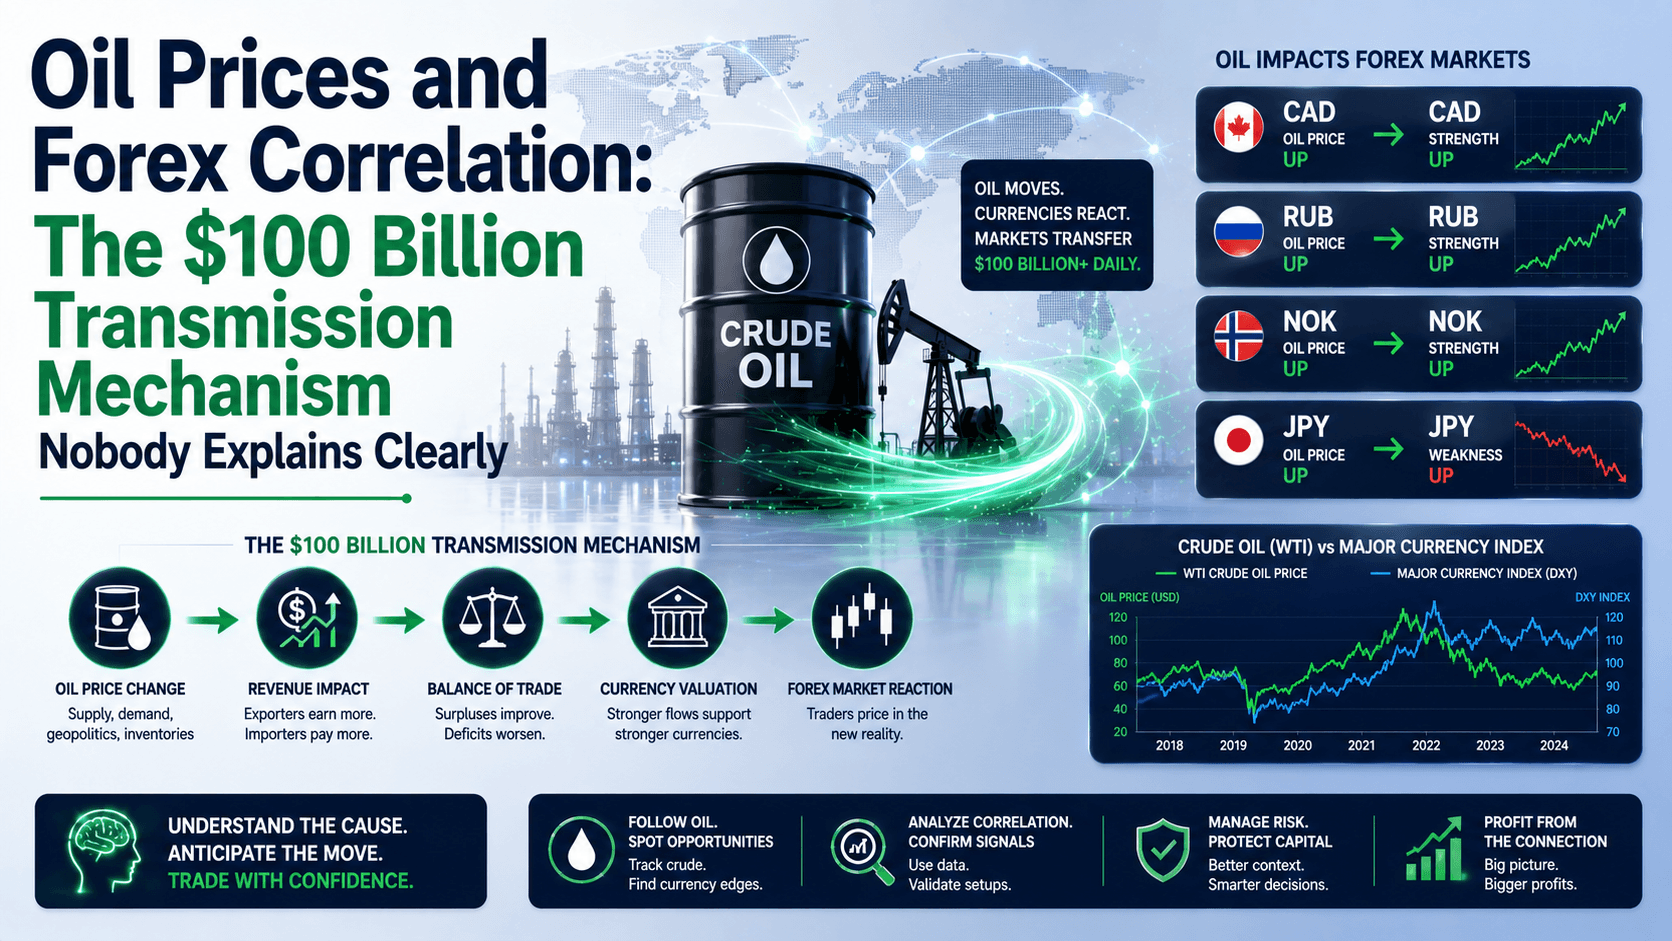
The mechanism is simpler than you think. Oil is priced in US dollars globally. Every barrel of crude traded — about 100 million barrels per day — is bought and sold in USD.
This creates two direct effects:
- Trade balance shifts — Oil exporters get more USD when prices rise. Importers pay more.
- Inflation transmission — Higher oil means higher transport costs, which means higher consumer prices.
Let's put numbers on it. Canada exports about 4.6 million barrels per day. At $70/barrel, that's $322 million daily revenue. At $100/barrel? $460 million. That extra $138 million per day flows into the Canadian economy, boosting CAD demand.
Compare that to Japan, which imports nearly all its oil. Higher prices drain their trade surplus. Yen weakens.
The Three Currency Types You Need to Know
Not all currencies react the same way. Here's the breakdown:
| Category | Examples | Oil Price Impact | Typical Correlation |
|---|---|---|---|
| Petrocurrencies (Exporters) | CAD, NOK, RUB | Oil up = currency up | Strong positive |
| Energy-importing currencies | JPY, KRW, INR | Oil up = currency down | Strong negative |
| Diverse economies | USD, EUR, GBP | Context-dependent | Moderate/conditional |
The data is clear. USD/CAD has historically shown a -0.7 to -0.95 correlation with oil prices. That's not "kind of related." That's almost a mirror image.
Real Trade Scenarios: Oil Prices and Forex Correlation in Action
Scenario A: Oil spikes, you're long USD/CAD
Let's say crude jumps from $75 to $95 in two weeks — a 27% move. Your USD/CAD position at 1.3500? It drops to 1.3200. On a standard 0.1 lot, that's a $300 loss. On 1.0 lot? $3,000.

This happened in 2022. Traders who ignored the correlation lost accounts.
Scenario B: Oil crashes, you're short CAD/JPY
Crude drops from $85 to $65. Canada's export revenue falls. CAD weakens. CAD/JPY drops from 95.00 to 92.00. Your short position? $300 profit on 0.1 lots.
The wrong way: "I'll just trade the chart." The right way: "I'll check oil first, then look at the chart."
The Petrodollar System — Why It Still Matters
After Bretton Woods collapsed in 1971, the US made a deal with Saudi Arabia: oil trades in USD. This created the petrodollar system.
Here's what that means for you:
- Every oil transaction requires USD — creating constant demand for the dollar
- When oil prices rise, more dollars flow to exporters like Russia and Saudi Arabia
- Those dollars get recycled into global markets — often back into US Treasuries
This is why oil prices and forex correlation isn't just about supply and demand. It's about the entire global financial plumbing.
How to Trade Oil Prices and Forex Correlation
Step 1: Identify the pair
Start with USD/CAD. It's the cleanest correlation. Check the 30-day correlation coefficient on TradingView. If it's above |0.7|, the relationship is active.
Step 2: Check oil direction
Look at WTI crude on the daily chart. Is it making higher highs? Lower lows? Sideways? This gives you directional bias.
Step 3: Align with fundamentals
Check the EIA weekly inventory report (Wednesdays at 10:30 AM ET). A drawdown of 5 million+ barrels is bullish for oil. A build of 5 million+ is bearish.
Step 4: Execute with risk management
Example setup:
- Oil at $78, showing bullish momentum
- USD/CAD at 1.3450, showing weakness
- Entry: Short USD/CAD at 1.3440
- Stop loss: 1.3520 (80 pips)
- Target: 1.3280 (160 pips)
- Risk:Reward = 1:2
- On 0.1 lots: risk $80, target $160
Comparison: Oil Correlation vs. Traditional Technical Analysis
| Factor | Oil Correlation | Technical Analysis Only |
|---|---|---|
| Lead time | 24-72 hours ahead | Reactive |
| Signal strength | High during supply shocks | Moderate |
| False signals | Lower when combined with fundamentals | Higher |
| Learning curve | Moderate (need macro awareness) | Low |
| Best for | Swing trading, position trading | Scalping, day trading |
FAQ
How reliable is oil prices and forex correlation?
Very reliable for petrocurrencies like CAD and NOK during supply-driven moves. Less reliable during demand-driven moves or when USD strength dominates.

Which forex pair has the strongest correlation with oil?
USD/CAD historically shows the strongest negative correlation, often -0.7 to -0.95. USD/NOK is a close second.
Does oil price affect USD/JPY?
Yes, but indirectly. Japan imports nearly all its oil, so higher prices weaken the trade balance and pressure JPY. However, USD/JPY is also driven by interest rate differentials and risk sentiment.
Can I trade oil directly instead of forex?
Yes, through CFDs or futures. But forex pairs like USD/CAD offer lower margin requirements and better liquidity for retail traders.
Quick Recap
- Oil prices and forex correlation is strongest for CAD, NOK, and JPY
- USD/CAD shows a -0.7 to -0.95 correlation with crude oil
- Check EIA inventory reports weekly for directional signals
- Always align oil direction with your forex trade bias
- Use correlation as a filter, not a standalone strategy
Quick Win
Open TradingView right now. Add WTI crude oil chart. Below it, add USD/CAD. Set both to daily timeframe. Scroll back to 2022 — see how they mirror each other? That's the correlation in action. Now check the current month. Is the relationship holding? If yes, you have a trading edge. If no, wait until it re-establishes.


