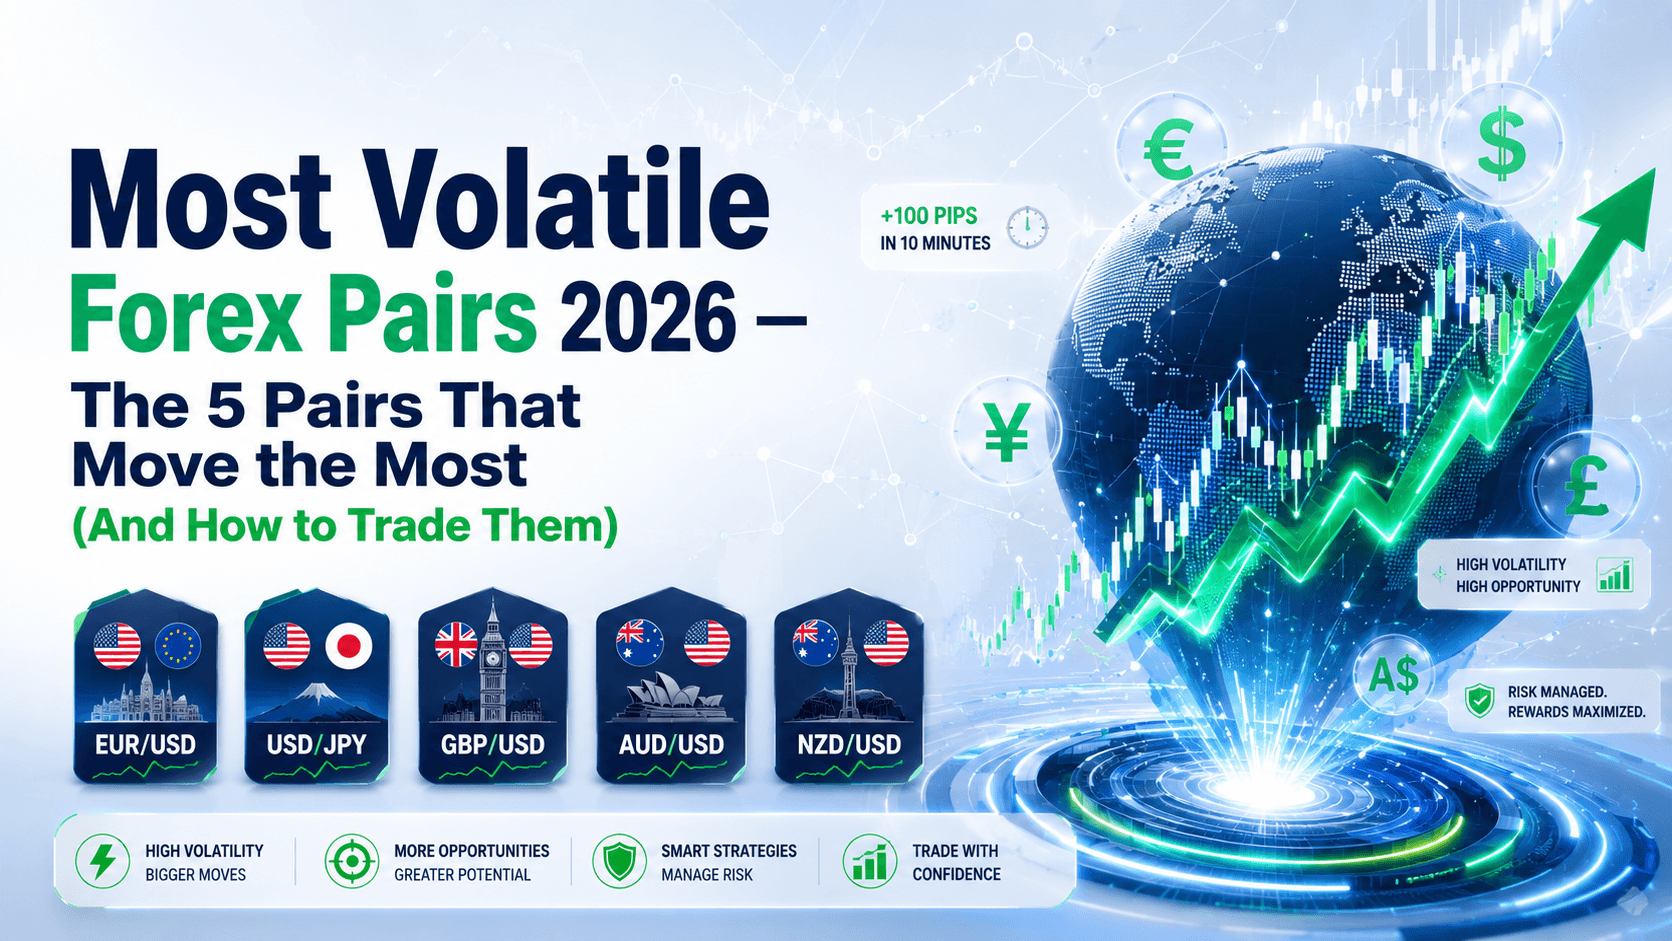

Ever Opened a Trade and Watched It Move 100 Pips in 10 Minutes?
Scary, right? But also exciting.
That's the reality of trading the most volatile forex pairs 2026 has to offer. These are the currency pairs that don't just sit there — they move. Big swings. Fast moves. Real profit potential.
But here's the thing nobody tells you: most beginners jump into these pairs thinking they'll get rich fast. What actually happens? They get stopped out before their coffee gets cold.
I've been trading for 10+ years, and I've made every mistake in the book with volatile pairs. I've blown accounts. I've also had my best trades on them. The difference? Understanding what makes them tick.
Let me show you the 5 most volatile forex pairs in 2026, why they move, and exactly how to trade them without getting wrecked.
What Makes a Forex Pair "Volatile" in 2026?
Volatility is just a fancy word for "how much does this thing move?"
Think of it like this: EUR/USD is like a calm lake. It moves, but slowly. USD/ZAR? That's the ocean during a storm. Big waves, fast currents, and you better know how to steer.
In technical terms, volatility measures how much a currency pair's price deviates from its average over a given period. The most volatile forex pairs 2026 are the ones that swing 100-200+ pips in a single day regularly.
Why do some pairs move more than others?
- Economic data: Interest rate decisions, GDP reports, employment numbers — these hit hard
- Commodity prices: Gold, oil, and metals affect commodity-linked currencies like AUD, NZD, and CAD
- Political events: Elections, trade wars, policy changes — uncertainty = volatility
- Low liquidity: Fewer traders in the market means each trade moves price more
The 5 Most Volatile Forex Pairs in 2026
Based on historical data and current market conditions, here are the pairs that consistently show the biggest daily ranges. These are the most volatile forex pairs 2026 traders are watching.

1. USD/ZAR — The Gold-Linked Giant
The US Dollar vs South African Rand. This is the king of volatility.
Why? South Africa is a major gold exporter. Gold is priced in USD. When gold moves, USD/ZAR moves. And gold has been swinging $50-$100 daily in 2026.
Real example: Let's say USD/ZAR is at 18.50. Gold prices spike on geopolitical news. The pair jumps to 18.80 in 30 minutes. That's 300 pips. On 0.1 lots, that's a $30 move. On 1.0 lots? $300 in half an hour.
But it works both ways. If gold drops, USD/ZAR can fall just as fast.
Average daily range in 2026: 150-250 pips
Best time to trade: London and New York overlap (12:00-16:00 UTC)
2. GBP/AUD — The Commonwealth Clash
The British Pound vs Australian Dollar. Two strong economies, but totally different drivers.
The pound moves on UK economic data and Brexit-related news. The Aussie dollar moves on commodity prices and China's economic health (since China is Australia's biggest trading partner).
When these two forces pull in opposite directions, GBP/AUD can explode.
Real example: UK inflation comes in higher than expected (bullish GBP). At the same time, China's manufacturing data disappoints (bearish AUD). GBP/AUD jumps from 1.9200 to 1.9450 in a few hours. That's 250 pips.
Average daily range in 2026: 120-180 pips
Best time to trade: London session (07:00-16:00 UTC) — both currencies are active
3. AUD/JPY — Risk-On, Risk-Off Rollercoaster
The Australian Dollar vs Japanese Yen. This pair is the ultimate barometer of global risk sentiment.
When investors feel good (risk-on), they buy AUD (commodity-linked, higher yield). When they get scared (risk-off), they buy JPY (safe haven, lower yield).
This creates massive swings, especially during Asian session news or global events.
Real example: A surprise rate cut from the Bank of Japan makes the yen weaker. At the same time, strong Australian jobs data boosts the Aussie. AUD/JPY shoots from 95.00 to 96.50 in one session. That's 150 pips.
Average daily range in 2026: 100-150 pips
Best time to trade: Tokyo and London overlap (07:00-09:00 UTC)
4. NZD/JPY — The Dairy-Driven Dynamo
Similar to AUD/JPY but even more volatile. The New Zealand dollar is heavily tied to agricultural exports (dairy, meat, wood), while the yen is the safe haven.
This pair can move 150+ pips in a single news event.
Real example: Global dairy prices jump 10% in an auction (bullish NZD). At the same time, a Bank of Japan official hints at policy tightening (bearish JPY). NZD/JPY rockets from 86.00 to 87.80. That's 180 pips.
Average daily range in 2026: 110-160 pips
Best time to trade: Tokyo session (00:00-09:00 UTC)
5. CAD/JPY — Oil's Best Friend
The Canadian Dollar vs Japanese Yen. Canada is a major oil exporter. Oil prices have been extremely volatile in 2026 due to supply concerns and global demand shifts.
When oil spikes, CAD strengthens. When oil crashes, CAD weakens. Meanwhile, the yen moves on its own safe-haven dynamics.
Real example: OPEC announces production cuts, oil jumps 5%. CAD/JPY rallies from 108.00 to 109.50. That's 150 pips.
Average daily range in 2026: 100-140 pips
Best time to trade: New York session (12:00-21:00 UTC) — oil data and Canadian economic releases
Volatile Pairs Comparison Table
| Pair | Avg Daily Range (2026) | Key Driver | Best Session | Risk Level |
|---|---|---|---|---|
| USD/ZAR | 150-250 pips | Gold prices, SA politics | London/NY overlap | Very High |
| GBP/AUD | 120-180 pips | UK data, China economy | London session | High |
| AUD/JPY | 100-150 pips | Risk sentiment, commodities | Tokyo/London overlap | High |
| NZD/JPY | 110-160 pips | Dairy prices, risk mood | Tokyo session | High |
| CAD/JPY | 100-140 pips | Oil prices, BoJ policy | New York session | Medium-High |
The Wrong Way vs The Right Way to Trade Volatile Pairs
Here's what most beginners do wrong:
The Wrong Way: See GBP/AUD moving 100 pips in an hour. Jump in with 0.5 lots because "it's moving so fast, I don't want to miss out." No stop loss. No plan. Price reverses 50 pips. You're down $250. You panic and close. Loss locked in.
Sound familiar? Yeah, I've done it too.
The Right Way: You have a $2,000 account. You want to trade AUD/JPY, which averages 120 pips daily. You risk 2% per trade = $40 max loss.
You calculate: 0.1 lots on AUD/JPY = $1 per pip (approximately). You set a stop loss at 40 pips = $40 risk. Target at 80 pips = $80 potential profit. Risk:reward = 1:2.
You wait for a pullback within the trend. Entry at 95.50. Stop at 95.10. Target at 96.30. Price hits target in 3 hours. You make $80. That's 4% on your account in one trade.
See the difference? It's not about catching every move. It's about catching the right move with the right size.
FAQ
What is the most volatile forex pair in 2026?
USD/ZAR (US Dollar vs South African Rand) is consistently the most volatile major pair, with average daily ranges of 150-250 pips driven by gold prices and political factors.

Are volatile forex pairs good for beginners?
No. Beginners should start with major pairs like EUR/USD or USD/JPY, which have tighter spreads and more predictable movements. Volatile pairs require experience, discipline, and strict risk management.
How much should I risk trading volatile pairs?
Risk 1-2% of your account per trade. On a $1,000 account, that's $10-$20 max loss per trade. Use smaller lot sizes (0.01-0.05) to keep risk manageable.
When is the best time to trade volatile pairs?
During session overlaps (London/New York, Tokyo/London) when liquidity is highest. Avoid trading during major news releases unless you have a specific strategy for them.
Quick Recap
- The most volatile forex pairs 2026 include USD/ZAR, GBP/AUD, AUD/JPY, NZD/JPY, and CAD/JPY
- Volatility comes from economic data, commodity prices, politics, and low liquidity
- Always use a stop loss — these pairs can reverse in seconds
- Risk 1-2% per trade max. Calculate your position size before entering
- Trade during session overlaps for better liquidity and cleaner moves
Quick Win — Do This Right Now
Open your trading platform. Pull up AUD/JPY on the 1-hour chart. Look at the last 5 candles. Measure the high-to-low range of each candle in pips. Average them. That's your expected daily range.
Now open USD/ZAR. Do the same thing. Notice how much bigger the ranges are? That's volatility in action.
Start tracking these ranges for a week. You'll start seeing patterns. And that's when the real trading begins.


