
What Is Mean Reversion? (And Why It Works in Forex)
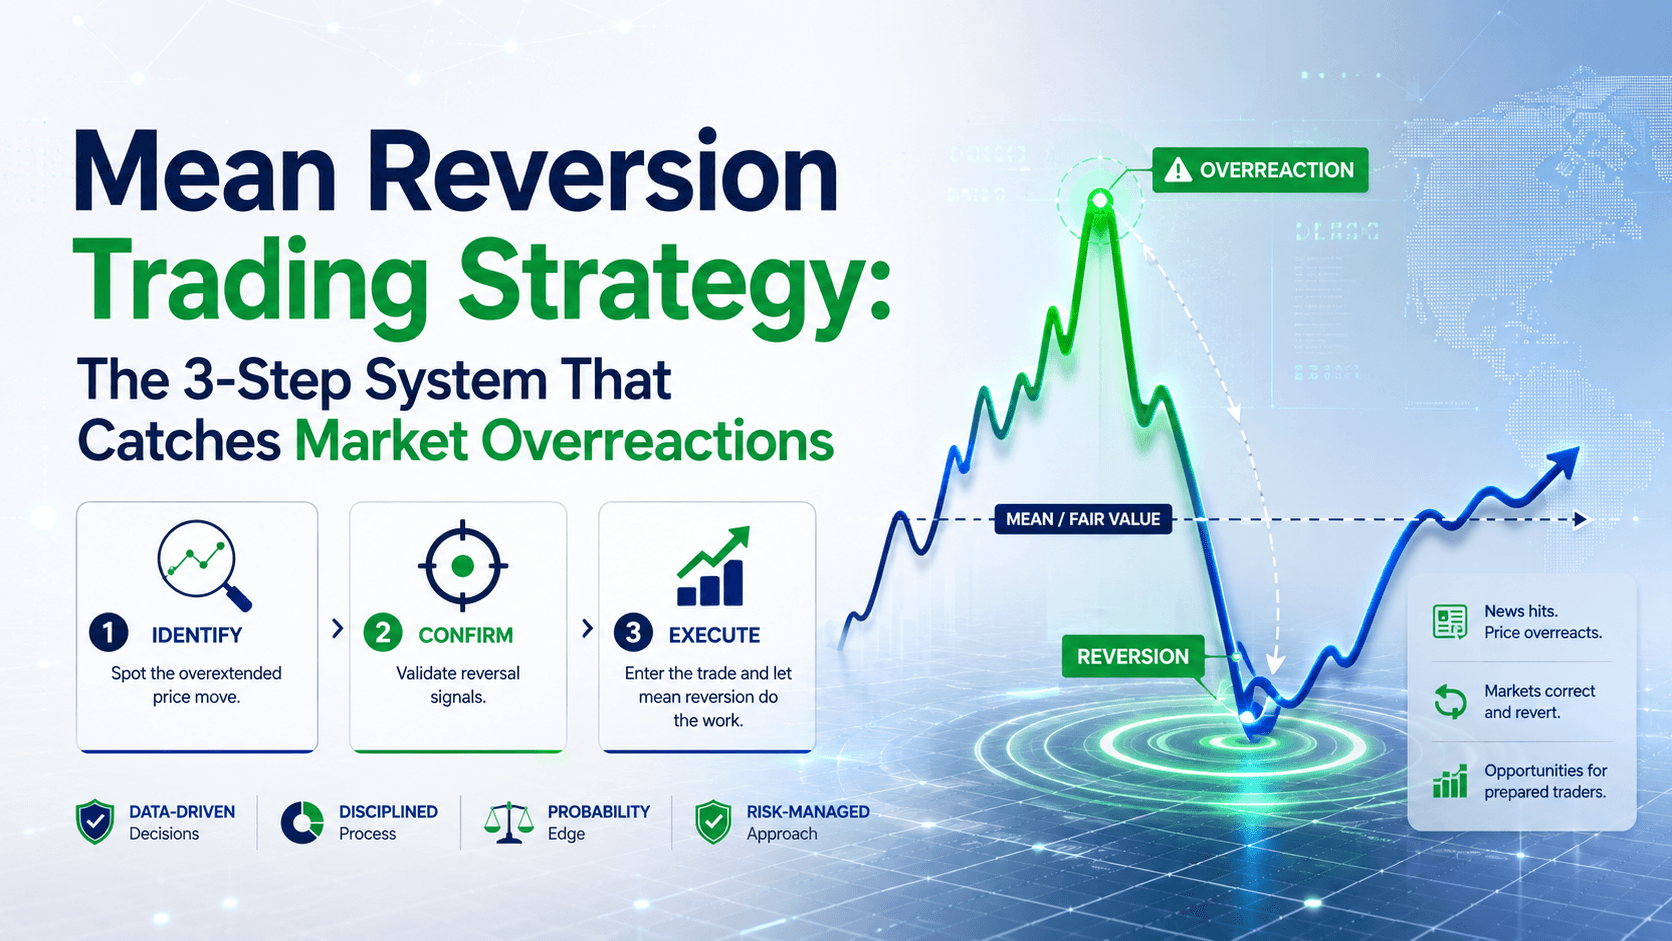
Here's the thing about markets — they overreact. A news headline drops, price spikes 50 pips in minutes, and everyone panics. Then, an hour later, price drifts right back to where it started.
That's mean reversion in action. Prices stretch too far from their average, then snap back. It's not magic. It's basic statistics. When EUR/USD trades 100 pips above its 20-period moving average in a ranging market, the probability of it returning to that average is high.
Think of it like a rubber band. The further you pull it, the harder it snaps back. Mean reversion traders don't predict direction. They bet on normalization.
Now, let's be clear: this strategy works best in range-bound markets — which is where forex spends roughly 70-80% of its time. When markets trend, mean reversion gets wrecked. We'll cover that too.
How Mean Reversion Differs from Trend Following
Same chart. Two completely different interpretations.
A trend follower sees EUR/USD break above resistance and thinks "momentum is building — buy the breakout." A mean reversion trader sees the same move and thinks "price is overextended — I'm fading this."
Neither is right or wrong. They work in different conditions:
| Trading Style | Best Market | Worst Market | Typical Win Rate |
|---|---|---|---|
| Mean Reversion | Ranging, sideways | Strong trends | 60-80% |
| Trend Following | Directional momentum | Choppy ranges | 40-50% |
The trap most beginners fall into? They try mean reversion during a trend. Price keeps moving away from the average, and they keep adding to losing positions. That's how accounts get blown.
Here's the rule: check the ADX first. If it's below 20-25, the market is ranging — mean reversion is your friend. If it's above 30, the market is trending — step aside.
The 3-Step Mean Reversion Trading System
Let's build a system you can use TODAY. No fluff. Just rules.

Step 1: Define the Mean
You need a reference point. The simplest? A 20-period SMA on the 1-hour chart. Why 20 periods? It captures roughly one trading week of price action — enough to be meaningful, not so much that it lags.
For slower swings, use the 50-EMA. For intraday scalping, use the 10-EMA. Pick one and stick with it.
Step 2: Spot the Stretch
Now you need to measure how far price has deviated. Use two tools together:
Bollinger Bands (20, 2): When price touches or breaches the upper or lower band, it's statistically stretched. In a normal distribution, 95% of price action should stay within 2 standard deviations.
RSI (14): Readings above 70 = overbought. Below 30 = oversold. Wait for a hook back through these levels for confirmation.
Example: EUR/USD at 1.0850. The 20-SMA is at 1.0830. RSI drops to 28. Price touches the lower Bollinger Band at 1.0845. That's a stretch. The rubber band is pulled.
Step 3: Confirm and Execute
Don't enter just because price touched a band. Wait for a confirmation signal:
- A bullish engulfing candle closing back inside the band
- A pin bar with a long lower wick at the band
- RSI turning back above 30
Entry: On the close of the confirmation candle. Long at 1.0847.
Stop loss: 1-2 ATR beyond the extreme. ATR(14) on EUR/USD 1H is roughly 9 pips. Place stop at 1.0829 (18 pips below entry).
Target 1 (primary): The 20-SMA at 1.0830. That's only 17 pips — but remember, you're aiming for the mean, not the moon.
Target 2 (optional): The opposite Bollinger Band at 1.0815 — only if price shows strong momentum back toward the mean.
Which Currency Pairs Work Best?
Not all pairs mean-revert equally. Some trend harder. Some oscillate like clockwork.
| Pair | Behavior | Best Use Case |
|---|---|---|
| EUR/USD | Ranges frequently during consolidation | Between major news events |
| EUR/CHF | Tight ranges, strong reversion | Asian session, quiet periods |
| AUD/NZD | Similar economies, oscillates well | London session |
| USD/JPY | Can trend hard — use with caution | Only when ADX < 20 |
| Gold (XAU/USD) | High volatility, wider bands | Scalping during London/NY overlap |
When Mean Reversion Fails (And How to Survive It)
Let's be honest. Mean reversion has a high win rate — 60-80% — but when it loses, it loses big. A trending market can wipe out weeks of small wins in one trade.
Real example: USD/JPY in 2012-2015. Price went from 78 to 125. That's 4,700 pips. If you were fading that move, you'd have been stopped out repeatedly. The Bank of Japan was printing money. The trend was your enemy.
Here's how to protect yourself:
- Use a trend filter. If the 50-EMA is sloping steeply up, don't short. Period.
- Keep position size small. Risk 0.5-1% per trade. Not 2%. Mean reversion losses can be 2-3x larger than wins.
- Time-based exits. If price hasn't reverted within 10-12 bars on the 1H chart, close the trade. You're wrong. Move on.
- Skip news events. NFP, FOMC, ECB — these create trend moves that don't revert in the short term.
FAQ
What win rate should I expect from a mean reversion trading strategy?
Well-designed systems typically achieve 60-80% win rates. But average losses are often larger than average wins. Profitability depends on risk-reward balance, not just win rate.

Which timeframe is best for mean reversion in forex?
The H1 and H4 timeframes offer the best balance between signal frequency and reliability. M15 and M5 generate more signals but also more noise. Start with H1.
Can I use mean reversion during news events?
Avoid it. News events often create trend moves that don't revert in the short term. The volatility spike may look like an overextension, but it can be the start of a sustained move. Wait for post-news consolidation.
How do I know if a market is ranging or trending?
Use the ADX indicator. Readings below 20-25 suggest range-bound conditions favorable for mean reversion. Readings above 25-30 indicate trending conditions where mean reversion is risky.
Quick Recap
- Mean reversion works when prices stretch too far from their average and snap back
- Use Bollinger Bands + RSI to spot overextensions
- Wait for confirmation (engulfing candle, pin bar) before entering
- Target the moving average (the mean) — not the opposite extreme
- Always check ADX first. Below 20 = go. Above 30 = skip.
- Risk 0.5-1% per trade. Mean reversion losses can be bigger than wins.
Your Quick Win (Do This Today)
Open your MT4 or TradingView chart. Pull up EUR/USD on the 1-hour timeframe. Add a 20-SMA and Bollinger Bands (20, 2). Scroll back through the last 50 candles. Find every instance where price touched the outer band and then closed back inside. That's a mean reversion signal. Count how many times it worked. That's your edge.
Now do the same with Gold (XAU/USD). Notice how the bands are wider? Higher volatility means wider stops. Adjust accordingly.


