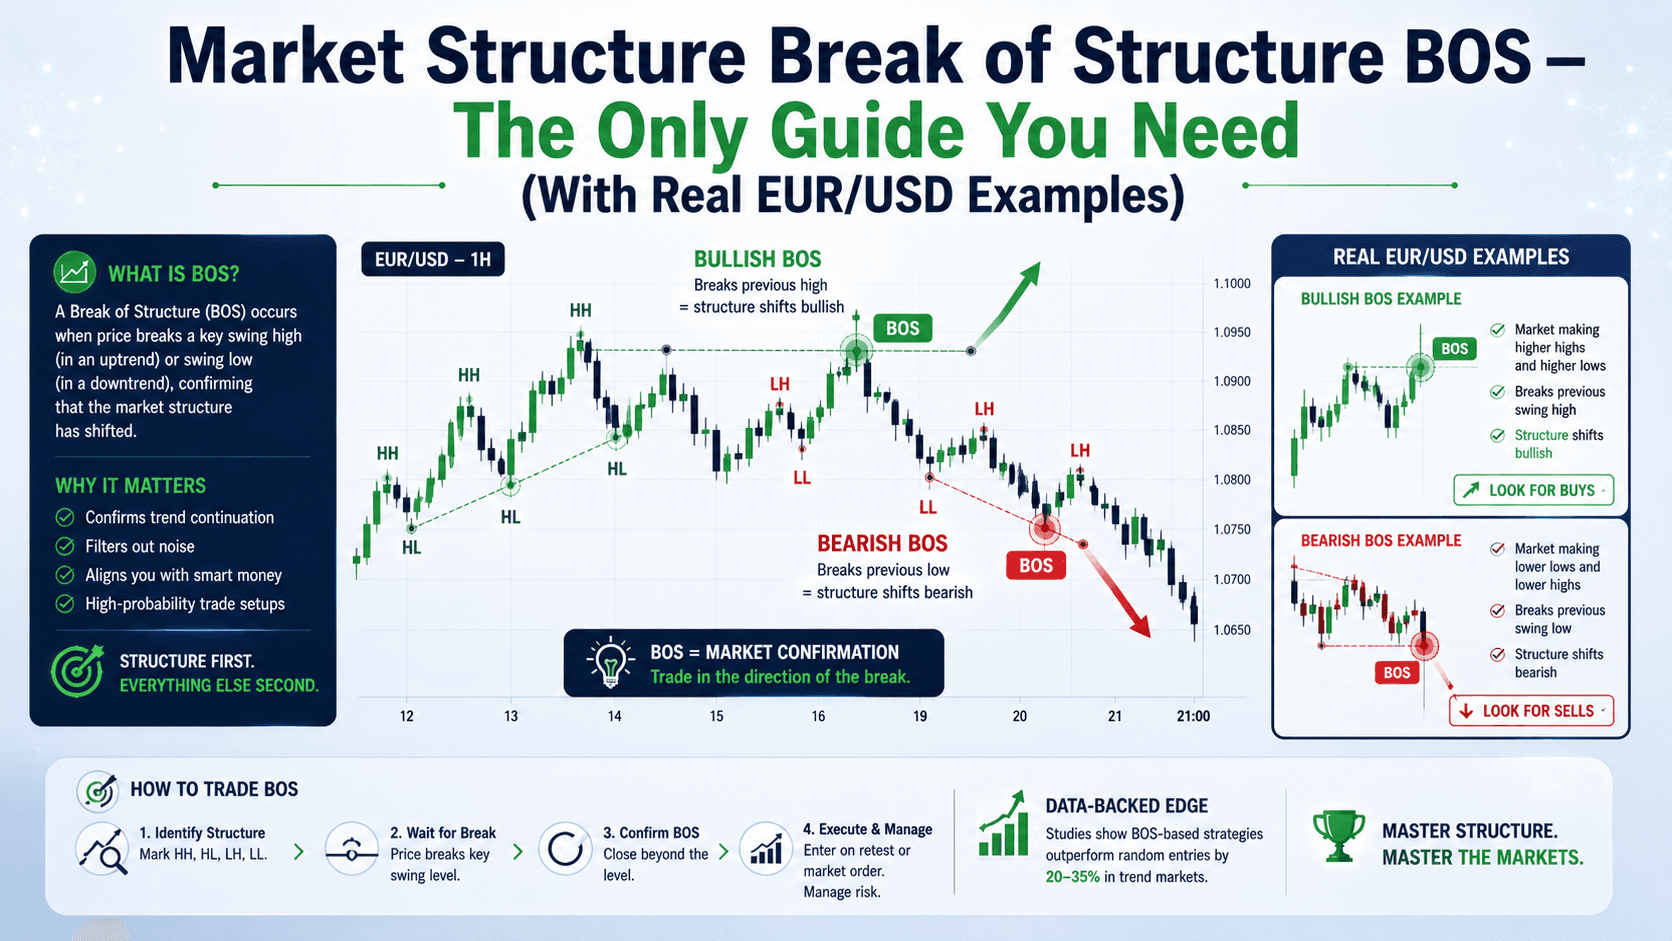

What Exactly is a Market Structure Break of Structure (BOS)?
Let's cut through the jargon. A market structure break of structure BOS is simply price confirming it wants to keep moving in its current direction. It's the market saying: "Yes, this trend is still alive."
Think of it like a train on a track. Each time price breaks a previous high (in an uptrend) or a previous low (in a downtrend), it's laying down more track in that direction. The trend continues.
Here's the key: BOS is confirmation, not an entry signal. You don't buy because of a BOS. You use it to stay in a trade or to add to a winning position.
Let's look at a real example. EUR/USD is at 1.0850. It makes a low at 1.0830, then rallies to 1.0870. That's a higher high. Then it pulls back to 1.0845, and rallies again to 1.0890. That's another higher high. The market structure is bullish. Each new high is a break of structure.
Bullish BOS vs Bearish BOS — The Two Flavors of Continuation
A bullish BOS happens when price breaks above a previous swing high, creating a higher high. A bearish BOS happens when price breaks below a previous swing low, creating a lower low.
The table below shows the exact conditions for each:
| Type | Condition | What It Means |
|---|---|---|
| Bullish BOS | Higher low (HL) → Higher high (HH) | Uptrend is continuing |
| Bearish BOS | Lower high (LH) → Lower low (LL) | Downtrend is continuing |
Here's the trap most beginners fall into: they see a single candle break a high and call it a BOS. That's not enough. You need a confirmed close above the previous high. A wick through it doesn't count. The candle must close above that level.
How to Identify a Valid Break of Structure (The Wrong Way vs The Right Way)
The Wrong Way
Most new traders see EUR/USD spike to 1.0900, breaking the previous high at 1.0890. They immediately go long. What happens next? Price reverses and takes them out. Why? Because the spike was a liquidity grab, not a genuine BOS.

This is the number one mistake. You're buying the top of a move, and the market knows it.
The Right Way
A valid BOS requires two things:
- 1. A confirmed close — The candle must close above the previous high (for bullish) or below the previous low (for bearish).
- 2. A retest — After the break, price often comes back to the broken level. This is your opportunity. You wait for the retest, then look for a change of character (CHoCH) on a lower timeframe to enter.
Let's put numbers on it. EUR/USD has a previous high at 1.0890. Price rallies and closes at 1.0895. That's a confirmed bullish BOS. Price then pulls back to 1.0885 (the retest). On the 5-minute chart, you see a bullish CHoCH — a higher low followed by a higher high. That's your signal to go long. You enter at 1.0890 with a stop at 1.0875 (15 pips risk). Target: 1.0920 (30 pips). Risk:reward = 1:2.
The Role of Inducement in BOS — Why It Matters
Here's a concept many sources skip: inducement. In ICT/SMC trading, a valid BOS often involves price first taking out an inducement level — a swing high or low where retail traders have placed their stops.
Think of it this way: Smart money needs liquidity to enter large positions. They push price to take out obvious levels, triggering stop losses, then reverse or continue the trend.
If EUR/USD breaks a previous high without taking out an inducement first, it's called a minor BOS. It's still valid, but the probability of continuation is lower. A BOS that happens after an inducement sweep has higher conviction.
Here's the data-driven comparison:
| Type of BOS | Inducement Sweep? | Probability of Continuation | Best Used For |
|---|---|---|---|
| Valid BOS | Yes | Higher (60-70%) | Adding to positions |
| Minor BOS | No | Moderate (40-50%) | Scalping or partial exits |
BOS vs Market Structure Shift (MSS) — The Key Difference
These two terms get confused all the time. Let's settle it once and for all.
BOS (Break of Structure) = Trend continuation. Price breaks a high/low in the direction of the current trend.
MSS (Market Structure Shift) = Trend reversal. Price breaks a key swing point against the current trend, signaling the trend is changing direction.
An MSS is equivalent to a Change of Character (CHoCH) in SMC terminology. It's the first sign that the old trend is ending and a new one is beginning.
Here's a concrete example:
- EUR/USD is in a downtrend: lower highs, lower lows.
- Price makes a lower low at 1.0800, then rallies to 1.0830 (a higher high).
- That higher high breaks the previous lower high? No — it actually breaks the structure up, against the downtrend. That's an MSS, not a BOS.
BOS = same direction. MSS = opposite direction. Simple.
How to Trade BOS — A Step-by-Step Strategy
Here's a strategy that combines BOS with multiple timeframe analysis. It's based on the approach used by experienced SMC traders.
Step 1: Identify the Trend on a Higher Timeframe
Start with the daily chart. Are you seeing higher highs and higher lows (uptrend) or lower highs and lower lows (downtrend)? This is your bias.
Step 2: Wait for a BOS on the Higher Timeframe
Price must break a previous high/low and close above/below it. Mark that level.
Step 3: Drop to a Lower Timeframe for the Retest
If the daily shows a bullish BOS, switch to the 1-hour or 30-minute chart. Wait for price to retest the broken level.
Step 4: Look for a CHoCH on the Lower Timeframe
On the 5-minute or 15-minute chart, wait for a bullish CHoCH (higher low → higher high). This is your entry signal.
Step 5: Enter with a Stop Loss and Target
Enter at the market after the CHoCH is confirmed. Stop loss below the recent swing low on the lower timeframe. Target the next major resistance level on the higher timeframe.
Let's run a real scenario:
- Daily chart: EUR/USD is in an uptrend. Price breaks above a previous high at 1.0900 and closes at 1.0910. Bullish BOS confirmed.
- 1-hour chart: Price retests the 1.0900 level and bounces.
- 5-minute chart: You see a bullish CHoCH — a higher low at 1.0895 followed by a break above 1.0905.
- Entry: 1.0905. Stop loss: 1.0890 (15 pips). Target: 1.0940 (35 pips). Risk:reward = 1:2.3.
- On a 0.1 lot: Risk = $15. Reward = $35. On a 0.5 lot: Risk = $75. Reward = $175.
FAQ
What is the difference between BOS and MSS?
BOS confirms trend continuation (breaks in the same direction). MSS signals a trend reversal (breaks against the current trend).

What timeframe is best for BOS?
BOS works on all timeframes, but the most common for intraday trading are the 15-minute, 30-minute, and 1-hour charts. Higher timeframes like 4-hour and daily are used for trend direction.
Can BOS be used with other indicators?
Yes. BOS is often combined with fair value gaps (FVG), order blocks, and change of character (CHoCH) for higher-probability setups.
Is BOS the same as a breakout?
Not exactly. A breakout is any move above a level. BOS specifically refers to breaking a previous swing high/low within an established trend, confirming continuation.
Quick Recap
- BOS confirms trend continuation — not a reversal.
- A bullish BOS = higher low → higher high. A bearish BOS = lower high → lower low.
- Always wait for a confirmed close above/below the level.
- Combine BOS with a retest and a CHoCH on a lower timeframe for entries.
- BOS ≠ MSS. BOS = same direction. MSS = opposite direction.
Quick Win
Open your chart right now. Pull up EUR/USD on the 1-hour timeframe. Find the last 3 swing highs and swing lows. Now check: is price currently making higher highs and higher lows (uptrend) or lower highs and lower lows (downtrend)? Mark the most recent break of structure. That's your bias for the next few candles. Do this every day for a week, and you'll start seeing market structure clearly.


