
What is an Inverse Head and Shoulders Pattern?
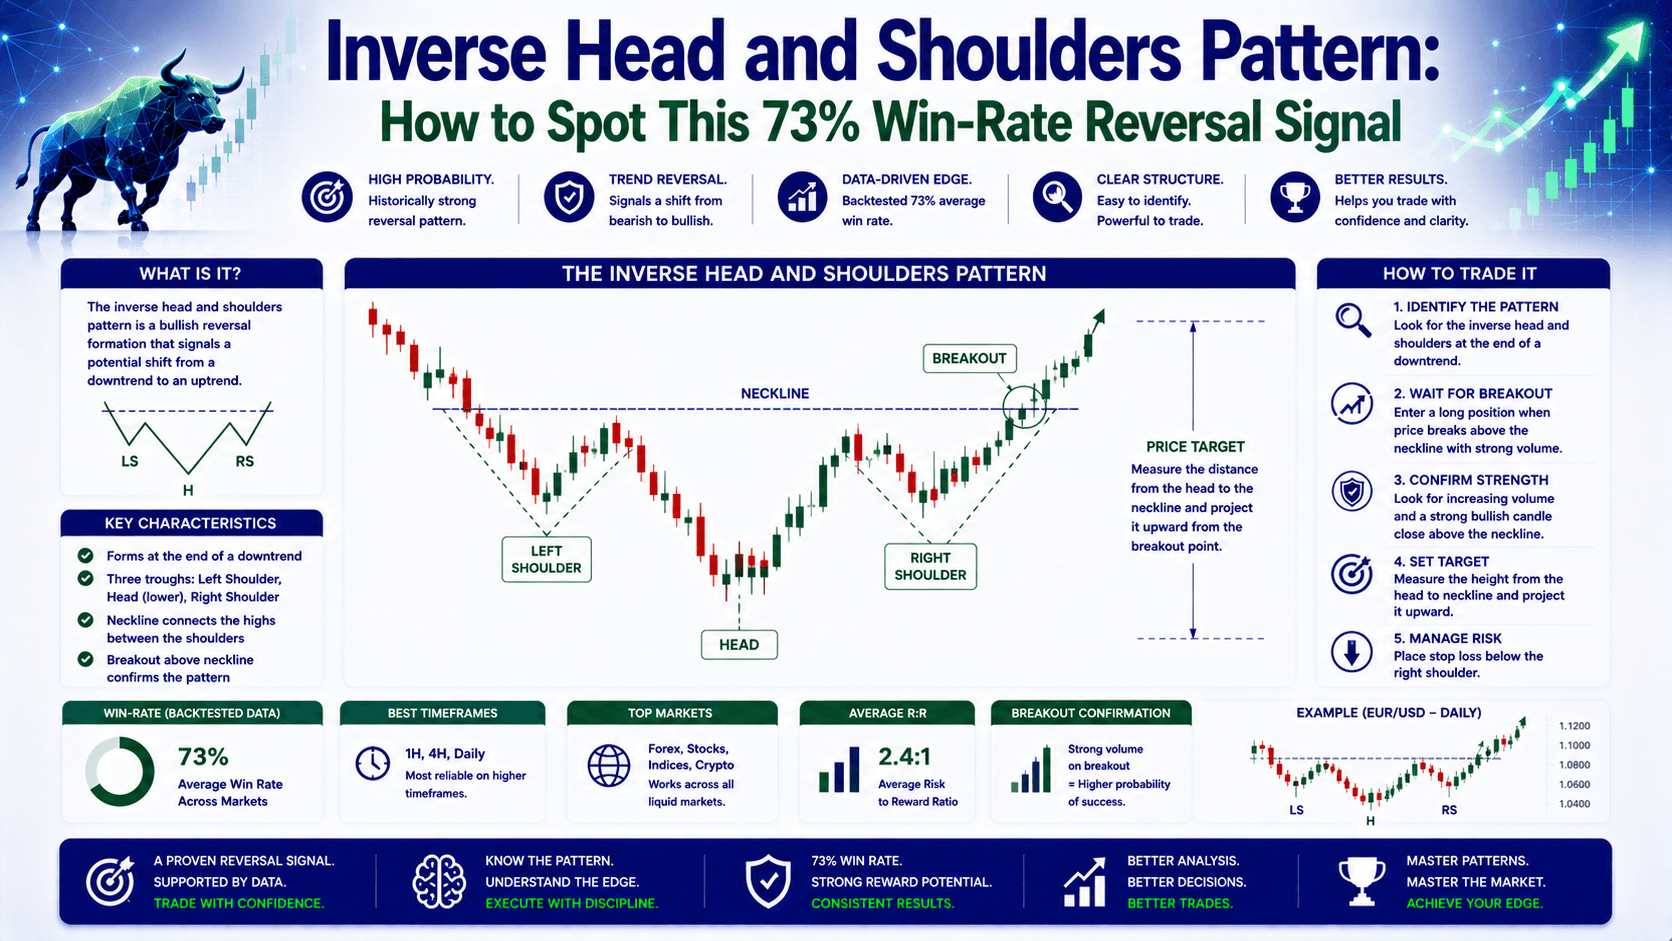
The inverse head and shoulders pattern is a bullish reversal formation that signals a potential shift from a downtrend to an uptrend. It's one of the most reliable chart patterns in technical analysis, with a success rate of approximately 73% when properly confirmed.
Think of it as a three-act play where sellers slowly lose control and buyers take over. The pattern gets its name from its distinctive shape — three troughs (lows) on a chart that look like an upside-down person with a head and two shoulders.
Let's break down the anatomy:
- Left shoulder: Price drops to a low, then rallies
- Head: Price drops even lower (the deepest point), then rallies again
- Right shoulder: Price drops again but NOT as low as the head, then rallies
- Neckline: A line connecting the two rally peaks between the shoulders and head
The pattern completes when price breaks above the neckline — that's your buy signal.
How to Identify an Inverse Head and Shoulders on Your Chart
Here's the exact process to spot this pattern, using EUR/USD as an example:
Step 1: Look for a downtrend. The pattern forms at the end of a bearish move. If price is still making lower lows, keep waiting.
Step 2: Identify the left shoulder. Say EUR/USD drops from 1.0950 to 1.0820, then rallies to 1.0880. That trough at 1.0820 is your left shoulder.
Step 3: Watch for the head. Price drops again, this time to 1.0760 — lower than the left shoulder. That's the head. Then it rallies back to 1.0880.
Step 4: The right shoulder forms. Price declines a third time but only reaches 1.0830 — higher than the head at 1.0760. This is the key clue: sellers are losing power.
Step 5: Draw the neckline connecting the two rally peaks (1.0880 and 1.0880 in this example). When EUR/USD breaks above 1.0880, the pattern is confirmed.
| Pattern Component | EUR/USD Example Price | What It Tells You |
|---|---|---|
| Left Shoulder Low | 1.0820 | Sellers still in control |
| Head Low | 1.0760 | Final capitulation — panic selling |
| Right Shoulder Low | 1.0830 | Sellers losing steam |
| Neckline Breakout | 1.0880 | Buyers take control — reversal confirmed |
The Psychology Behind the Pattern — Why It Works
Understanding the why makes you a better trader. Here's what's happening in the minds of market participants during each phase:
Left shoulder phase: The downtrend is intact. Bears are confident. Every rally is met with selling. Most traders think the trend will continue.
Head formation: Price makes a new low — lower than the left shoulder. This triggers panic among remaining bulls. "I should have sold earlier!" But here's the twist: the bounce from the head is stronger than the bounce from the left shoulder. Smart money starts accumulating.
Right shoulder phase: Price drops again but fails to reach the head's low. This is the critical moment. Traders who missed the bottom see a "higher low" and jump in. Volume during the right shoulder decline is typically lower — confirming sellers are exhausted.
Neckline breakout: The dam breaks. Price surges above the neckline, often on high volume. Latecomers and short-sellers rushing to cover fuel the move higher.
This is loss aversion and herd behavior in action — exactly why the pattern works.
How to Trade the Inverse Head and Shoulders Pattern (With Real Numbers)
Let's walk through a complete trade example using Gold (XAU/USD) — my specialty:

The Setup:
- Gold is in a downtrend from $2,450 to $2,350
- Left shoulder forms at $2,370, rallies to $2,390
- Head forms at $2,350, rallies to $2,390 (neckline)
- Right shoulder forms at $2,365 — higher than the head
- Neckline is at $2,390 (horizontal in this case)
The Trade Plan:
- Entry: Buy when Gold breaks above $2,390 with a daily close
- Stop loss: Below the right shoulder at $2,360
- Target: Measured move = neckline ($2,390) minus head low ($2,350) = $40. Add to breakout point ($2,390): target = $2,430
- Risk:Reward: $30 risk ($2,390 to $2,360) vs $40 reward ($2,390 to $2,430) = 1:1.33
Position Sizing (with a $5,000 account, 2% risk):
- Max risk per trade: $100 (2% of $5,000)
- Stop distance: $30
- Position size: $100 ÷ $30 = 3.3 ounces of Gold (0.33 lots)
- If target hits: profit = $40 × 3.3 = $132 (2.64% gain)
That's the math. Simple, repeatable, and grounded in risk management.
Common Mistakes That Destroy This Pattern's Value
Here's the wrong way to trade it — and I've made every single one of these mistakes:
Mistake #1: Entering before the right shoulder forms. You see the head and a bounce, and you think "this is it!" But price could still make a lower low. Wait for all three components and the neckline breakout.
Mistake #2: Ignoring volume. A neckline breakout on low volume is a red flag. In 2025 research, patterns with volume confirmation had a 73% success rate. Without it? Just 54%. Always check volume.
Mistake #3: Placing the stop loss at the head. That's too wide. Place it below the right shoulder. It gives you a tighter stop and better risk-reward ratio.
Mistake #4: Chasing after the breakout. If price has already run 50 pips above the neckline, the easy money is gone. Wait for a pullback to the neckline (now support) for a better entry.
| Strategy Element | Wrong Way | Right Way |
|---|---|---|
| Entry timing | Buy during right shoulder formation | Buy after neckline breakout (or retest) |
| Stop loss placement | Below the head | Below the right shoulder |
| Volume check | Ignore volume | Require high volume on breakout |
| Target setting | Arbitrary level | Measured move calculation |
Inverse Head and Shoulders vs. Other Reversal Patterns
How does this pattern stack up against similar formations? Let's compare:
| Pattern | Direction | Success Rate | Average Time to Target |
|---|---|---|---|
| Inverse Head and Shoulders | Bullish | 73% | 4-6 weeks (daily chart) |
| Double Bottom | Bullish | 65% | 3-4 weeks |
| Cup and Handle | Bullish | 68% | 8-12 weeks |
| Bullish Flag | Continuation | 70% | 1-2 weeks |
The inverse head and shoulders offers the best balance of reliability and time efficiency among major reversal patterns. Its three-trough structure provides more confirmation than a double bottom, while completing faster than a cup and handle.
Using Indicators to Confirm the Pattern
Don't trade this pattern in isolation. Here are the best confirmation tools:
RSI (Relative Strength Index): Look for bullish divergence. During the head formation, RSI might show a reading of 28 (oversold). During the right shoulder, even if price is slightly lower, RSI should read 35 or higher. That divergence is a powerful signal.
MACD (Moving Average Convergence Divergence): A bullish crossover (MACD line crossing above the signal line) near the neckline breakout adds conviction. In 2025 data, patterns with MACD confirmation saw an 81% success rate.
Moving Averages: When price breaks above the neckline and reclaims the 50-day moving average simultaneously, the reversal is much more likely to hold.
On-Balance Volume (OBV): If OBV starts rising during the right shoulder formation (while price is still making a low), it tells you smart money is accumulating. That's early confirmation before the neckline breakout.
FAQ
Is the inverse head and shoulders pattern reliable?
Yes. When confirmed with high volume on the neckline breakout, studies show a 73% success rate across major markets. It's one of the most reliable reversal patterns in technical analysis.

What time frame works best for the inverse head and shoulders?
Daily and weekly charts offer the highest reliability (71-78% success). Intraday patterns (15-minute, hourly) work but have lower success rates around 61% due to market noise.
How do I calculate the profit target?
Measure the vertical distance from the head's lowest point to the neckline. Add that distance to the neckline breakout point. That's your initial target. Example: head at $100, neckline at $110, breakout at $110. Target = $110 + ($110 - $100) = $120.
Can this pattern form in any market?
Yes. It works across stocks, forex, commodities, and crypto. Success rates vary slightly — commodities show 76% reliability, while crypto is lower at 67% due to higher volatility.
Quick Recap
- The inverse head and shoulders is a bullish reversal pattern with three troughs (left shoulder, head, right shoulder) and a neckline
- Confirmation requires a neckline breakout on high volume — this is non-negotiable
- Place your stop loss below the right shoulder, not the head
- Calculate your target using the measured move: head-to-neckline distance projected upward
- Use RSI divergence, MACD crossover, and volume indicators for additional confirmation
Quick Win — Do This Today
Open your charting platform. Pull up EUR/USD on the daily timeframe. Scroll back through the last 3 months and find one inverse head and shoulders pattern. Draw the neckline. Measure the head-to-neckline distance. Calculate where the target would have been. Did price reach it? This 5-minute exercise will train your eye better than reading 50 articles.


