
The Hidden Risk in Every Trade You Place Without Checking the Calendar
You've done your technical analysis. Support and resistance are clear. Your entry is set. You enter a long position on EUR/USD at 1.0850 with a 20-pip stop. Fifteen minutes later, price drops 40 pips in a single minute. Your stop is hit. You're out $20 on a 0.1 lot position.
What happened? The US Consumer Price Index (CPI) data was released. You didn't check the economic calendar. That $20 loss was avoidable.
Data from the Bank for International Settlements shows that major economic releases can move currency pairs by 50-100 pips within minutes. For a trader with a $1,000 account risking 2% per trade, that's your entire risk budget for the week gone in one unexpected move.
The economic calendar is not an optional tool. It's the foundation of risk management for any trader who wants to survive beyond their first month. This article will show you exactly how to use economic calendar trading to protect your capital and identify high-probability opportunities.
What Is an Economic Calendar and Why Does It Matter?
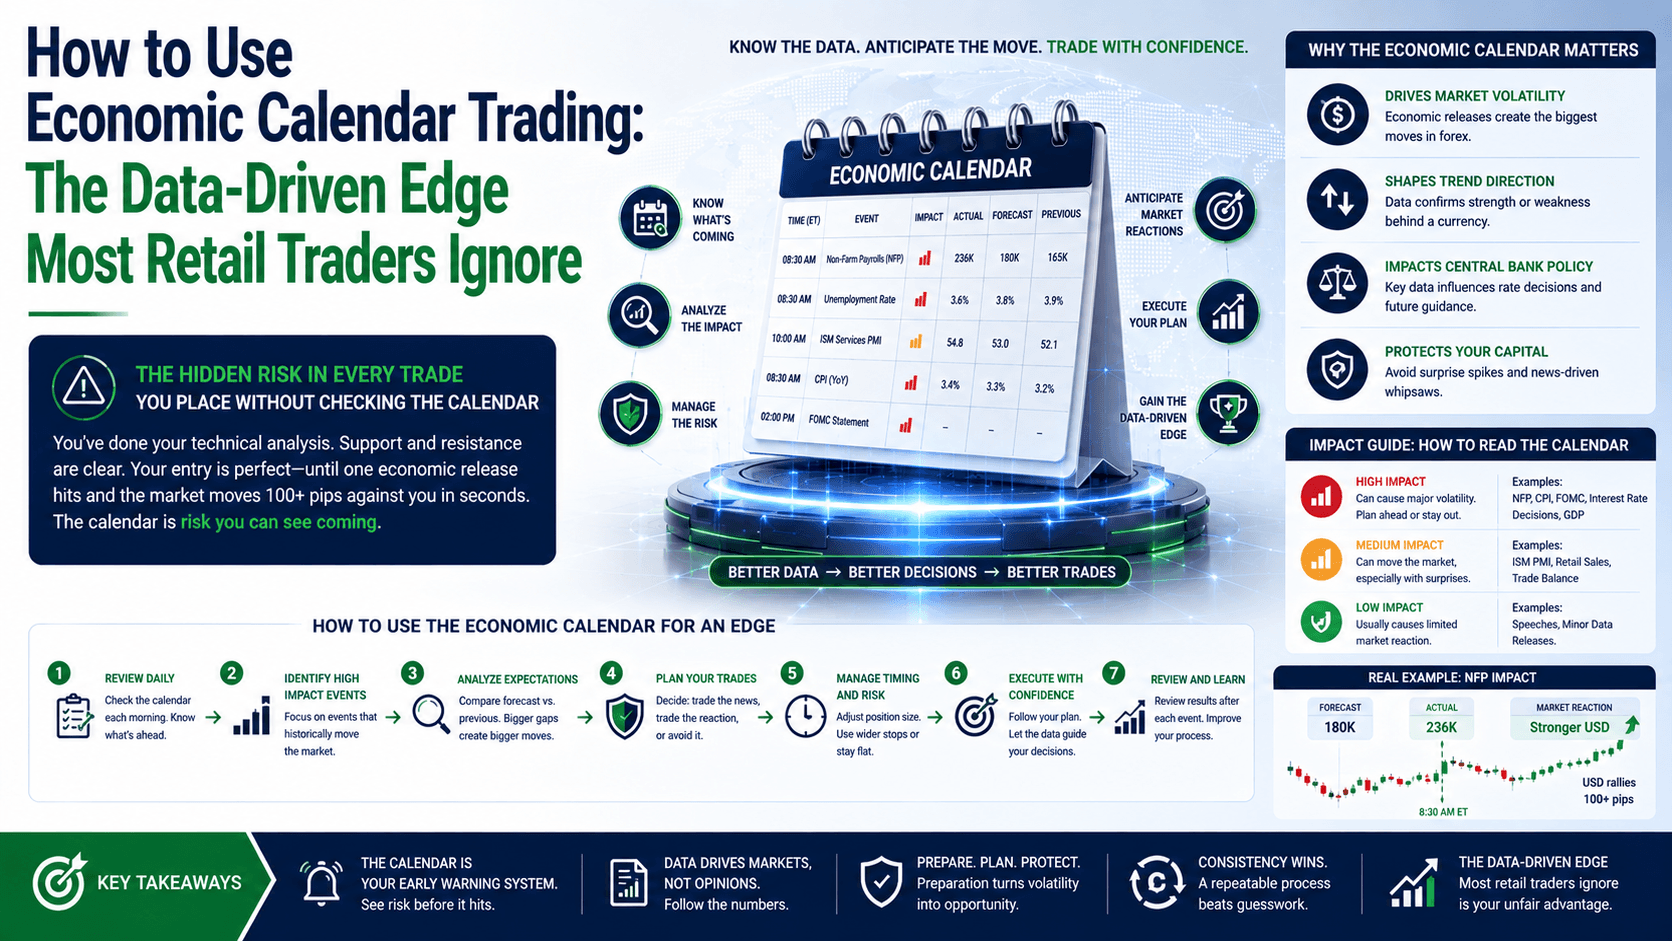
An economic calendar is a schedule of upcoming economic data releases, central bank decisions, and political events that have historically moved financial markets. It provides the date, time, expected value, previous value, and volatility impact for each event.
The forex market trades $6.6 trillion daily. But during major economic releases, volume concentrates around specific currency pairs, creating rapid price movements. Understanding these events gives you a structural advantage that technical analysis alone cannot provide.
Consider this: in 2024, US Non-Farm Payrolls (NFP) data moved EUR/USD an average of 85 pips within the first 30 minutes of release. A trader holding a position during that window without awareness was essentially gambling, not trading.
The economic calendar transforms you from a reactive trader into a prepared one. You know what's coming. You can decide whether to trade through the event, reduce position size, or step aside entirely.
How to Read an Economic Calendar: The 5 Key Data Points
Every economic calendar displays the same core information. Here is what each column means and why it matters for your trading decisions.

| Column | What It Shows | Why It Matters |
|---|---|---|
| Time | The exact release time (typically GMT or your local time zone) | Markets often consolidate before major releases. Knowing the exact time lets you prepare. |
| Event | The name of the economic indicator (e.g., "US CPI MoM") | Different events have different impact levels. CPI and NFP are high-impact. Housing data is typically medium-impact. |
| Previous | The last month's reading | This sets the baseline. Is the economy accelerating or slowing down? |
| Forecast (Consensus) | The market expectation based on economist surveys | This is what the market has already priced in. The surprise comes from the difference between actual and forecast. |
| Actual | The real data once released | Compare this to the forecast. A deviation of 10% or more typically causes significant volatility. |
Most calendars also include a volatility indicator — usually color-coded (red for high, yellow for medium, green for low). This tells you how much the market typically moves around that release.
The 3 Most Important Economic Events for Forex Traders
Not all economic data is equal. Focus your attention on these three categories, which historically produce the strongest and most consistent market reactions.
1. Central Bank Interest Rate Decisions
Interest rates are the single most important driver of currency values. When the Federal Reserve raises rates, USD typically strengthens because global investors move capital toward higher yields.
Data from the Federal Reserve shows that a 25-basis-point rate change can shift USD/JPY by 80-120 pips within 24 hours. For a trader using 0.1 lots, that's $80-$120 per 100 pips on USD/JPY. On 0.5 lots, it's $400-$600.
The key distinction here is between the rate decision itself and the forward guidance that accompanies it. The market often prices in the decision before it happens. The real volatility comes from the central bank's statement about future policy.
2. US Non-Farm Payrolls (NFP)
Released on the first Friday of every month at 8:30 AM EST, NFP measures the change in the number of employed people in the US, excluding farm workers. It is the most closely watched labor market indicator globally.
Evidence from historical data shows that NFP releases have moved EUR/USD by an average of 85 pips in the first 30 minutes. The range widens significantly when the actual figure deviates from the consensus by more than 50,000 jobs.
In January 2019, the consensus was for 177,000 jobs. The actual print was 312,000 — a deviation of 76%. EUR/USD dropped over 100 pips in 15 minutes. A trader with a 0.5 lot position and no stop loss would have lost $500 in that window.
3. Consumer Price Index (CPI)
CPI measures the change in the price of goods and services from the consumer's perspective. It is the primary measure of inflation that central banks use to set interest rate policy.
In 2023-2024, the Federal Reserve raised rates to 5.5% specifically to combat high CPI readings. Every CPI release during that period moved USD pairs by 60-90 pips on average.
The takeaway? If you trade USD pairs, you need to know the CPI release schedule. Mark it on your calendar. Plan around it.
How to Use Economic Calendar Trading: 3 Practical Strategies
Knowing the data is not enough. You need a system for acting on it. Here are three evidence-based approaches.
Strategy 1: The Pre-Event Exit
This is the simplest and most effective strategy for beginner and intermediate traders.
Before the event: Check the economic calendar every morning. Identify any high-impact events (red volatility indicator) that fall within your trading session.
During the event: Close all open positions 15 minutes before the release. Wait 30 minutes after the release before entering new trades.
Why this works: The majority of retail traders lose money during news events because they don't have the infrastructure to trade fast-moving markets. By stepping aside, you preserve capital. You can then re-enter once price has established a clear direction.
In practice, this translates to: if you have a EUR/USD long position at 1.0850 and US CPI is releasing in 15 minutes, close the trade. The 20 pips you might gain is not worth the 80 pips you could lose on a surprise reading.
Strategy 2: The Breakout Trade
This strategy is for traders with experience and fast execution capabilities.
Before the event: Identify key support and resistance levels on the 15-minute or 5-minute chart. Set buy-stop and sell-stop orders 10-15 pips above resistance and below support.
After the release: When price breaks through a level, the order triggers automatically. Set a stop loss at the opposite side of the range. Set a take profit at 1.5x to 2x your risk.
Example: EUR/USD is trading at 1.0850 before NFP. Resistance is at 1.0870, support at 1.0830. You set a buy-stop at 1.0885 and a sell-stop at 1.0815. NFP prints at 312,000 vs 177,000 expected. Price drops to 1.0810, triggering your sell-stop. You're short at 1.0815 with a stop at 1.0870 (55 pip risk) and a target at 1.0750 (65 pip gain). Risk:reward = 1:1.18.
A common misconception is that you need to predict the direction. You don't. You let the market tell you which way it's moving, and you ride the momentum.
Strategy 3: The Swing Trader's Approach
Swing traders can use economic events as confirmation of existing trends.
Before the event: Identify the prevailing trend on the daily chart. If EUR/USD is in a downtrend, you want to sell into strength during a news event.
After the release: Wait for the initial volatility to settle (typically 15-30 minutes). Look for price to retrace toward a key moving average or support/resistance level within the trend. Enter in the direction of the trend.
Example: EUR/USD has been in a downtrend for three weeks. NFP comes out stronger than expected. EUR/USD drops 60 pips in 10 minutes, then retraces 30 pips higher as traders take profits. You enter short at the retracement level, with a stop above the pre-NFP range and a target at the recent low.
Research from the Bank for International Settlements indicates that trends established after major economic releases tend to persist for 2-5 days, making this a viable swing trading approach.
Common Mistakes When Using the Economic Calendar
Even experienced traders make these errors. Avoid them.
Mistake 1: Trading every event. Not all red-volatility events are tradeable. Some produce whipsaw movements that stop out both sides. Only trade events where you have a clear plan and the deviation from consensus is significant.
Mistake 2: Ignoring the consensus. The market prices in the expected number. If CPI comes out exactly at the forecast, the market often doesn't move. The volatility comes from deviations. Always compare actual to forecast, not actual to previous.
Mistake 3: Holding positions through events without adjustment. If you choose to hold, reduce your position size by at least 50%. A 0.1 lot trade becomes 0.05 lots. This limits your exposure if the move goes against you.
FAQ
How far in advance should I check the economic calendar?
Check it daily before your trading session begins. Also review the next week's events every Sunday to plan your overall trading schedule.

Can I trade profitably without using an economic calendar?
Technically yes, but you are taking unnecessary risk. A single unexpected release can wipe out weeks of gains. Professional traders always check the calendar before entering any trade.
What is the best economic calendar for forex traders?
Forex Factory and Investing.com offer free, reliable calendars with clear volatility indicators and consensus data. Trading Economics provides more detailed historical data.
How long does volatility last after an economic release?
Initial volatility typically lasts 15-30 minutes. Extended price discovery can continue for 2-4 hours. The trend direction established in the first hour often sets the tone for the rest of the session.
Quick Recap
- The economic calendar shows scheduled releases that move markets. Check it every morning.
- Focus on central bank decisions, NFP, and CPI — these produce the strongest reactions.
- The market moves on deviation from consensus, not the absolute number.
- Three strategies: exit before the event, trade the breakout, or use the event to confirm trends.
- Never trade every event. Have a plan. Reduce position size if you hold through releases.
Your Quick Win
Open your economic calendar right now. Find the next high-impact event for USD, EUR, or GBP. Write down the date, time, consensus, and previous value. Set an alarm for 15 minutes before the release. When it goes off, close any open positions in that currency pair. Watch the release without trading. Note how price reacts to the deviation. Do this for three events before you attempt to trade one. This builds the discipline that separates professionals from amateurs.


