
Why Most Traders Get Market Structure Wrong
Here's a scenario I see every week. A trader opens a chart on EUR/USD at 1.0850. Price drops 20 pips, then bounces. They think "support held" and go long. Price drops another 30 pips. They double down. Price drops 50 more pips. Now they're down $100 on a 0.1 lot — and they have no idea why the trade failed.
The problem isn't that they were wrong about direction. The problem is they didn't understand market structure. They saw a bounce and assumed it meant something. But without knowing the sequence of highs and lows, that bounce is just noise.
Learning how to read market structure forex is the difference between guessing and actually knowing where price is likely to go. Let's break it down with real numbers and a framework you can use today.
What Is Market Structure in Forex? (The Simple Definition)
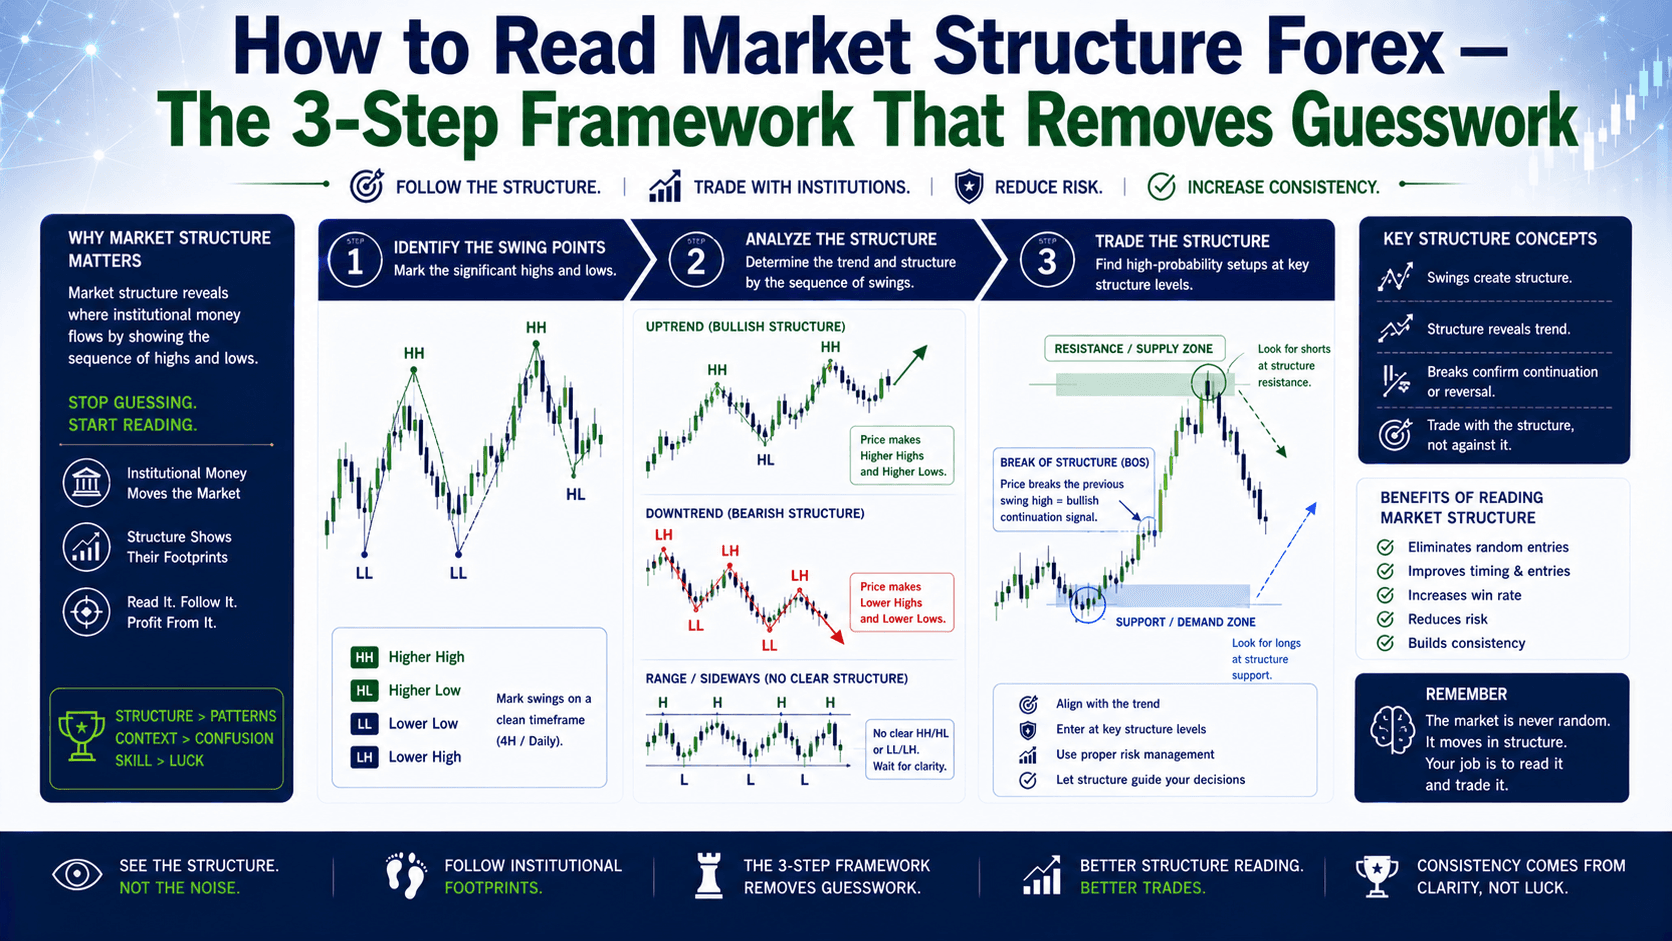
Market structure is the sequence of swing highs and swing lows that price creates over time. It tells you whether the market is trending up, trending down, or moving sideways. That's it. No magic indicators. No complex formulas. Just highs and lows in a specific order.
Think of it like a staircase. An uptrend is a staircase going up — each step is higher than the last. A downtrend is a staircase going down — each step is lower. A range is a flat landing — price bounces between two levels.
Here's why this matters for how to read market structure forex: every major move — whether it's a breakout, a pullback, or a reversal — shows up first in the structure. If you can read the staircase, you can anticipate the next step.
The 3 Core Components of Market Structure
To read market structure, you need to identify three things on any chart:

1. Swing Highs and Swing Lows
A swing high is a peak — price goes up, then reverses down. A swing low is a valley — price goes down, then reverses up. These are the building blocks of structure.
On a 1-hour EUR/USD chart, you might see a swing high at 1.0875, then a swing low at 1.0850, then a higher swing high at 1.0890. That sequence tells you buyers are in control.
2. The Sequence (HH, HL, LL, LH)
Once you have swing points, look at the sequence:
- Higher High (HH) — each peak is higher than the last
- Higher Low (HL) — each valley is higher than the last
- Lower Low (LL) — each valley is lower than the last
- Lower High (LH) — each peak is lower than the last
An uptrend is HH + HL. A downtrend is LL + LH. A range is when you get neither — highs and lows stay roughly equal.
3. Break of Structure (BOS) and Change of Character (CHOCH)
These are the two signals that tell you when structure is changing:
- BOS (Break of Structure) — price breaks the previous swing high (in an uptrend) or swing low (in a downtrend). This confirms the trend is continuing.
- CHOCH (Change of Character) — price breaks the last swing low in an uptrend (or swing high in a downtrend). This signals a potential reversal.
Let's see these in action with real numbers.
Real Trade Example: Reading Structure on EUR/USD
Imagine EUR/USD is at 1.0850. Here's the structure from the last few hours:
- Swing low at 1.0830
- Swing high at 1.0860 (HH)
- Pullback to 1.0845 (HL — above 1.0830)
- Price breaks above 1.0860 — that's a BOS
The structure says: uptrend is intact. You can look for a long entry on the next pullback. Your stop goes below the last HL at 1.0845. Your target is the next swing high — maybe 1.0890.
Now let's say price breaks below 1.0845 instead. That's a CHOCH. The uptrend is failing. You should not be buying. You might even look for a short if price breaks below 1.0830.
This is how to read market structure forex in practice. No guessing. Just a clear set of rules.
Market Structure vs. Indicators: Which Is Better?
Let's compare reading structure directly to using a common indicator like RSI or MACD.
| Factor | Market Structure | RSI (Example) |
|---|---|---|
| Lag | Minimal — price tells you immediately | High — RSI lags behind price |
| Objectivity | Clear rules (HH/HL = uptrend) | Subjective — overbought/oversold levels vary |
| False Signals | Fewer — structure changes only at key levels | More — RSI can stay overbought for hours |
| Ease of Learning | Steep at first, then simple | Easy to learn, hard to use profitably |
| Best For | Trend identification and trade timing | Momentum confirmation |
The data suggests: for identifying the trend and timing entries, market structure is more reliable. Indicators can help confirm, but structure is the foundation.
The Wrong Way vs. The Right Way to Use Structure
The Wrong Way: You see a swing high and a swing low and think "that's structure." You enter a trade without checking the sequence. Price reverses immediately because you missed the fact that the last swing was a lower high — you were trading against the trend.
The Right Way: You identify the sequence first. If you see LL + LH on the 4-hour chart, you know the trend is down. You wait for a pullback (a small LH) and enter short. Your stop goes above the previous LH. Your target is the next LL. The structure gives you the plan.
Here's the key: how to read market structure forex is not about finding one swing point. It's about understanding the relationship between all the recent swings. One higher high means nothing. A sequence of higher highs and higher lows means everything.
FAQ
Is market structure the same as price action?
Not exactly. Price action is the study of all price movement — candles, patterns, momentum. Market structure is a subset of price action that focuses specifically on swing highs and swing lows to define the trend. Structure is the skeleton; price action is the full picture.

How do I identify swing highs and swing lows?
A simple rule: a swing high is a candle with higher highs on both sides. A swing low is a candle with lower lows on both sides. On a 1-hour chart, look for at least two candles on each side to confirm. The more timeframes you check, the more reliable the swing point becomes.
What timeframe is best for reading market structure?
Start with the 4-hour or daily chart for the overall trend. Then drop to the 1-hour or 15-minute chart for entries. Higher timeframes give you the big picture; lower timeframes give you precision. Never trade structure on a 1-minute chart alone — it's too noisy.
Can I use market structure with other indicators?
Yes. Many traders combine structure with moving averages or support/resistance levels. But structure should be your primary tool — it tells you the trend. Use indicators only for confirmation, not for the main decision.
Quick Recap
- Market structure is the sequence of swing highs and swing lows — HH + HL = uptrend, LL + LH = downtrend
- BOS confirms the trend is continuing; CHOCH signals a potential reversal
- Always identify the sequence before entering a trade — one swing point means nothing
- Use higher timeframes for direction, lower timeframes for entry
- Structure is more reliable than most indicators for trend identification
Quick Win
Open your chart right now. Pull up EUR/USD on the 4-hour timeframe. Find the last 5 swing highs and swing lows. Label them as HH, HL, LL, or LH. What's the sequence? Is the trend up, down, or sideways? Do this for 3 different currency pairs today. In 10 minutes, you'll start seeing the market's language.


