
Why Most Trading Strategies Fail (And How Backtesting Fixes It)
Here's a hard truth: 90% of retail traders lose money. And the #1 reason? They take a strategy they found online, trade it with real cash, and discover the hard way that it doesn't work.
I've been there. Early in my career, I blew a $2,000 account in three weeks using a "simple" moving average crossover system I found on a forum. The problem wasn't the strategy. It was that I never tested it.
Backtesting is how you avoid that. It's the process of applying your trading rules to historical market data to see how they would have performed. Think of it as a flight simulator for your trading strategy. You get to crash as many times as you want — without losing a single dollar.
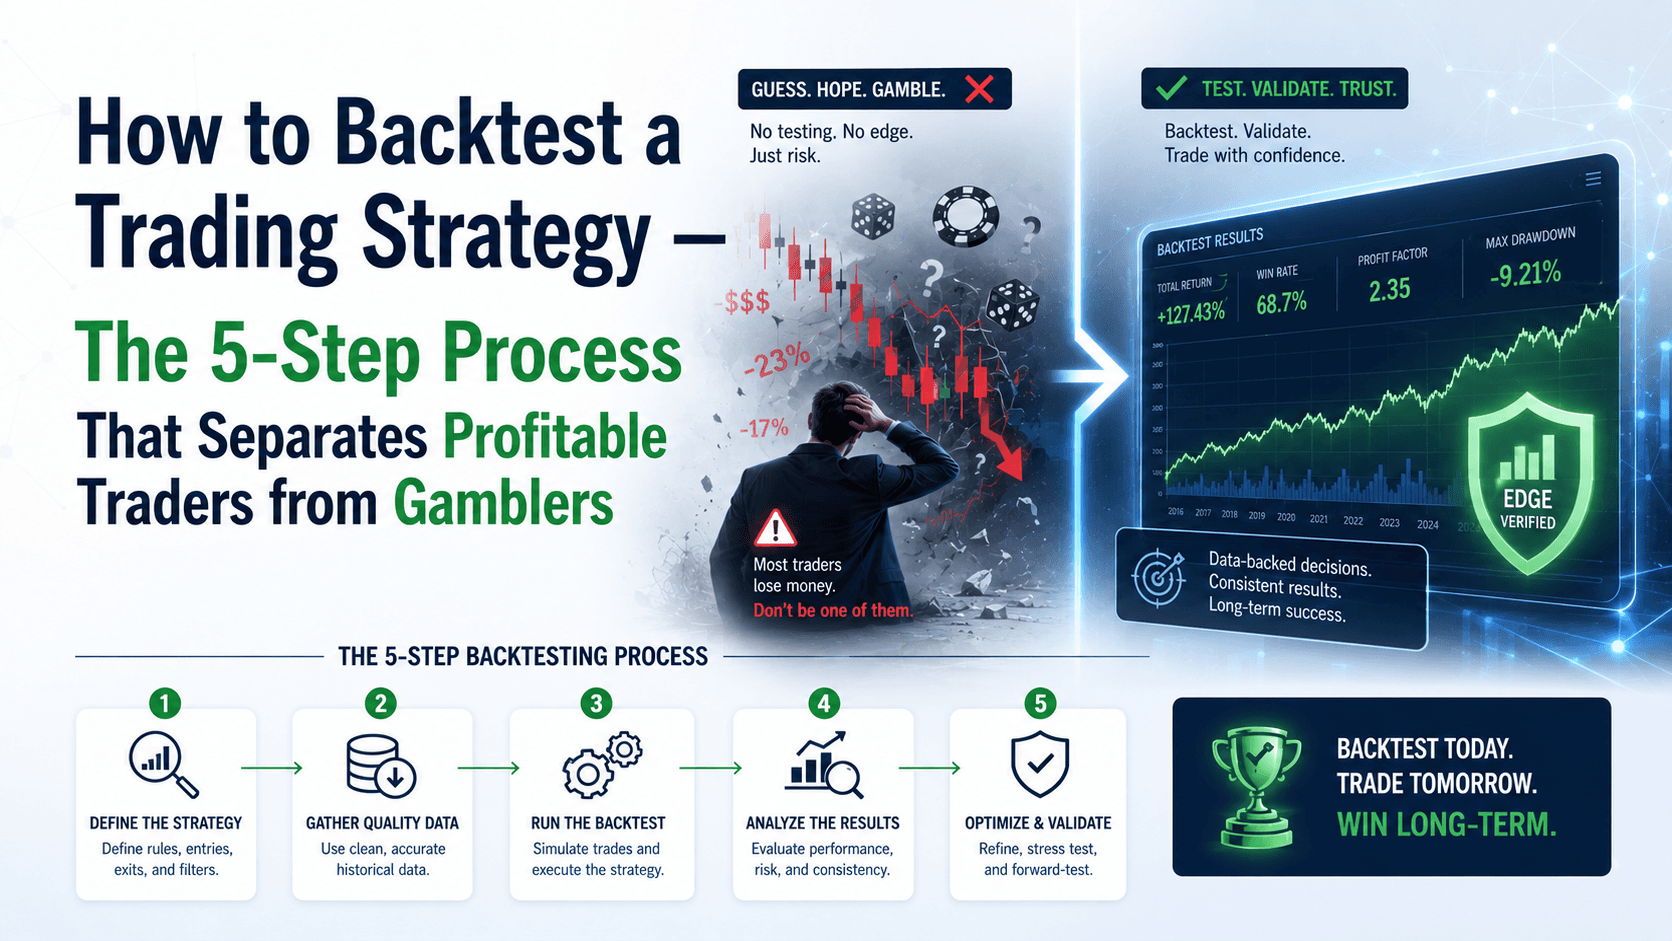
In this lesson, I'll show you exactly how to backtest a trading strategy in 5 steps. By the end, you'll know how to validate any strategy, spot its weaknesses, and build the confidence to trade it live.
What Is Backtesting a Trading Strategy? (And Why It's Non-Negotiable)
Backtesting is simple: you take your trading rules, apply them to past price data, and record every trade. The goal is to see if your strategy has a positive expectancy — meaning it makes more money than it loses over a large sample of trades.
Professional traders don't guess. They know their strategy's win rate, average risk-to-reward ratio, and maximum drawdown before they ever click "buy" or "sell." Backtesting gives you that knowledge.
Without it, you're gambling. With it, you're trading.
What Backtesting Can Tell You
- Win rate: What percentage of your trades are profitable?
- Risk-to-reward ratio: How much do you make on winners vs. lose on losers?
- Maximum drawdown: What's the worst losing streak you could face?
- Profit factor: For every $1 you lose, how much do you make?
- Consistency: Does the strategy work in bull, bear, and sideways markets?
Step 1: Define Your Strategy Rules (No Ambiguity Allowed)
Before you even open a chart, you need crystal-clear rules. If your strategy has any "maybe" or "it depends" in it, you're not ready to backtest.
Here's an example of a clear rule set for a simple trend-following strategy on EUR/USD:
- Timeframe: 1-hour chart
- Entry: When the 50 EMA crosses above the 200 EMA, look for a buy. When it crosses below, look for a sell.
- Confirmation: Only enter if the candle closes above (buy) or below (sell) the crossover point.
- Stop loss: 30 pips below the recent swing low (buy) or above the recent swing high (sell).
- Take profit: 60 pips (2:1 risk-to-reward).
- Risk per trade: 1% of a $5,000 account = $50 max loss.
- Position size: $50 risk ÷ 30 pip stop = $1.67 per pip = 0.16 lots.
See the difference? Every rule is specific and measurable. There's no "look for a good entry." There's no "use your judgement." That's how you get reliable backtest results.
Step 2: Choose Your Backtesting Method and Tools
You have two main options: manual or automated. Each has its strengths.

| Method | Best For | Time Required | Accuracy |
|---|---|---|---|
| Manual | Beginners, discretionary strategies | Hours to days | Lower (human error) |
| Automated | Algorithmic strategies, large datasets | Minutes to hours | Higher (no bias) |
Manual Backtesting (The Hands-On Approach)
This is where you physically scroll through historical charts, candle by candle, and record every trade in a spreadsheet. It's time-consuming, but it forces you to really understand your strategy.
Tools you'll need:
- A charting platform (MetaTrader 4, TradingView, or Forex Tester)
- A spreadsheet (Excel or Google Sheets)
- A notepad for observations
How to do it:
- Open your chart and scroll back to your starting date.
- Set the chart to show one candle at a time.
- Advance candle by candle. When your entry conditions are met, record the trade.
- Log the entry price, stop loss, take profit, exit price, and result.
- Continue until you have at least 100-200 trades.
Pro tip: Don't look ahead. If you see a big move coming, it's easy to "accidentally" enter earlier than your rules allow. Scroll forward one candle at a time to avoid bias.
Automated Backtesting (The Fast Track)
If your strategy can be coded into an Expert Advisor (EA) or a Pine Script, you can run thousands of trades in minutes. MetaTrader 4 has a built-in Strategy Tester for this. TradingView's Pine Editor also supports backtesting.
How to do it on MT4:
- Load your EA into the Strategy Tester (View → Strategy Tester).
- Select your symbol (e.g., EURUSD), timeframe (e.g., H1), and date range.
- Set the initial deposit (e.g., $5,000) and other parameters.
- Click "Start" and let it run.
- Review the report: profit factor, win rate, max drawdown, and equity curve.
Step 3: Run the Backtest and Log Everything
Whether you go manual or automated, you need to log detailed data for each trade. Here's what to record:
- Date and time of entry
- Entry price
- Stop loss price
- Take profit price
- Exit price (if stopped out or hit target)
- Result in pips and dollars
- Win or loss
- Notes (e.g., "price consolidated for 2 hours before hitting SL")
Let's say you backtested the EMA crossover strategy on EUR/USD from January 2024 to December 2024. Here's what one trade might look like:
- Date: March 15, 2024, 14:00 GMT
- Entry: 1.0875 (50 EMA crossed above 200 EMA, candle closed above)
- Stop loss: 1.0845 (30 pips)
- Take profit: 1.0935 (60 pips)
- Exit: 1.0935 (hit TP)
- Result: +60 pips, +$96 (0.16 lots)
- Win/Loss: Win
Step 4: Analyze the Results — The Numbers That Matter
Once you have 100+ trades, it's time to crunch the numbers. Don't just look at total profit. Look at these key metrics:
Win Rate
What percentage of trades were winners? If you had 45 wins out of 100 trades, your win rate is 45%.
Average Risk-to-Reward Ratio
Divide your average win (in pips) by your average loss. If your average win is 55 pips and your average loss is 30 pips, your R:R is 1.83:1.
Profit Factor
Divide total profits by total losses. A profit factor of 1.5 means you make $1.50 for every $1 you lose. Anything above 1.5 is solid. Above 2.0 is excellent.
Maximum Drawdown
This is the biggest peak-to-trough drop in your account balance during the backtest. If your $5,000 account dropped to $4,200 at its worst, your max drawdown is $800 (16%).
⚠️ This is the most important risk metric. If your max drawdown is 30%, can you stomach seeing your account drop by $1,500? If not, adjust your risk or strategy.
Expectancy
This tells you how much you can expect to make (or lose) per trade on average. Formula: (Win Rate × Average Win) - (Loss Rate × Average Loss).
Example: (0.45 × $80) - (0.55 × $43) = $36 - $23.65 = $12.35 per trade. Positive expectancy = profitable strategy.
Step 5: Optimize and Forward Test
If your backtest shows a profitable strategy, don't go live yet. You need to check for overfitting — when a strategy is too perfectly tuned to past data and fails in live markets.
Out-of-Sample Testing
Reserve the last 20-30% of your historical data (e.g., the final 3 months of 2024) and test your strategy on that unseen data. If it performs similarly, you're in good shape. If it tanks, you've overfitted.
Forward Testing (Paper Trading)
Trade the strategy on a demo account for at least 1-2 months. This tests it in real-time market conditions. Record every trade just like you did in the backtest.
If the forward test results match your backtest results within 10-20%, you're ready to go live.
FAQ
How many trades do I need for a valid backtest?
At least 100 trades. The more, the better. 200+ trades give you statistically significant results. Anything under 50 is unreliable.

Can I backtest a discretionary strategy?
Yes, but it's harder. You need to define your rules as objectively as possible. If you can't write them down clearly, you can't backtest them accurately.
What's the difference between backtesting and forward testing?
Backtesting tests your strategy on past data. Forward testing (paper trading) tests it on live market data without risking real money. Both are essential before going live.
Does backtesting guarantee future profits?
No. Market conditions change. A strategy that worked in 2024 may not work in 2025. But a thoroughly backtested strategy gives you a much higher probability of success than trading on a whim.
📝 Quick Recap
- Backtesting is applying your trading rules to historical data to evaluate performance
- You need clear, specific rules before you start
- Manual backtesting is hands-on; automated is faster but requires coding
- Log every trade with entry, exit, pips, and dollars
- Analyze win rate, profit factor, max drawdown, and expectancy
- Always do out-of-sample and forward testing before going live
Your Quick Win: Backtest One Trade Right Now
Open your charting platform. Scroll back to January 1, 2024, on the EUR/USD 1-hour chart. Apply a 50 EMA and 200 EMA. Find the first crossover event in January. Record the entry, stop loss (30 pips below swing low), and take profit (60 pips). Move forward candle by candle and see what happens.
That's one trade. Do 99 more, and you'll know if your strategy works.
Start today. Your future trading account will thank you.


