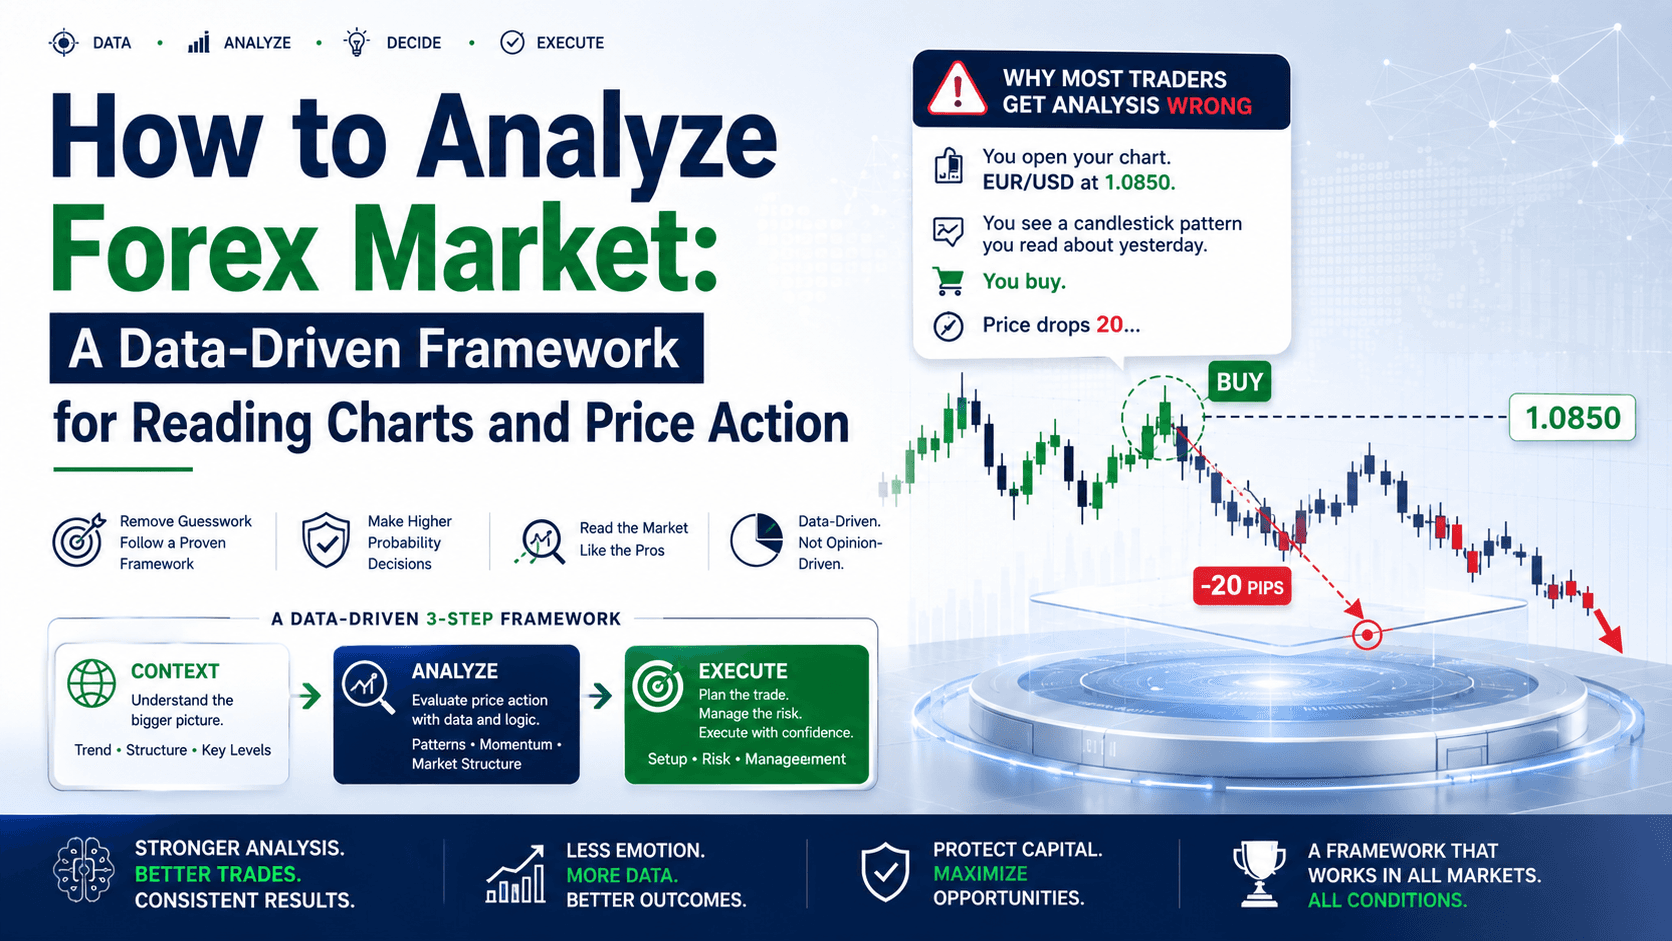

Why Most Traders Get Analysis Wrong
You open your chart. EUR/USD at 1.0850. You see a candlestick pattern you read about yesterday. You buy. Price drops 20 pips. You panic-sell. Price reverses and hits your original target 30 minutes later.
Sound familiar? That's not a bad trade. That's bad analysis.
The problem isn't that you don't know how to analyze forex market data. The problem is you're looking at the wrong things in the wrong order. Let's fix that.
The 3-Step Framework for Analyzing Any Forex Chart
Here's the deal: professional traders don't jump straight into candlestick patterns or indicators. They follow a hierarchy. Skip a step, and your analysis falls apart.
Step 1: Identify the Market Structure First
Before you look at a single candle, answer this: Is the market trending or ranging?
Pull up GBP/USD on the 4-hour chart. Draw a straight line connecting the recent swing lows. If the line goes up — uptrend. If it goes down — downtrend. If price keeps bouncing between two horizontal lines — range.
Here's why this matters: 70% of the time, price moves sideways. If you're trying to trade breakouts in a range, you'll get stopped out every time. The data proves it.
| Market Condition | What to Do | What NOT to Do |
|---|---|---|
| Uptrend (higher highs, higher lows) | Buy pullbacks to support | Short at resistance |
| Downtrend (lower highs, lower lows) | Sell rallies to resistance | Buy at support |
| Range (price between two horizontal levels) | Buy at support, sell at resistance | Chase breakouts |
Real numbers: EUR/USD is in a clear uptrend. Price pulls back from 1.0880 to 1.0845. You buy 0.1 lots at 1.0845 with a stop at 1.0825 (20 pip risk = $20). Target at 1.0895 (50 pip target = $50). Risk:reward = 1:2.5. The trend gives you the edge.
Step 2: Mark Key Support and Resistance Zones
Once you know the structure, draw the levels where price has reacted multiple times. Don't draw single lines — draw zones. A support zone might be 1.0820 to 1.0830, not a single line at 1.0825.
Why zones matter: Price often overshoots support by 5-10 pips before bouncing. If your stop is at the exact level, you'll get stopped out by 2 pips. That's the difference between a winning trade and a losing one.
On USD/JPY at 150.50, if support is at 150.20, don't place your stop at 150.20. Place it at 150.10. Yes, your risk is 10 pips more. But you actually stay in the trade when price dips 8 pips below support and reverses.
Technical Analysis vs Fundamental Analysis: Which One to Use?
This is the classic debate. Here's the honest answer: Use both, but for different decisions.

Technical analysis tells you when to enter and exit. Fundamental analysis tells you why price is moving. They work together.
Let's compare:
| Factor | Technical Analysis | Fundamental Analysis |
|---|---|---|
| Data source | Price charts, patterns, indicators | Economic data, news, central bank policy |
| Timeframe | Seconds to months | Days to years |
| Best for | Entry and exit timing | Long-term trend direction |
| Example signal | Bullish engulfing at support | Fed rate hike expectation |
| Weakness | Ignores news catalysts | Can't time precise entries |
Real scenario: It's Wednesday. The Fed just announced a 0.25% rate hike. The USD strengthens. You know the fundamental direction: USD up, EUR/USD down. But do you short immediately? No. You wait for a technical setup — a bearish candlestick pattern at a resistance level on the 1-hour chart. That's combining both.
The 3 Candlestick Patterns You Actually Need
There are dozens of candlestick patterns. Most are noise. Here are the three that matter:
1. Engulfing Candles
A bullish engulfing: a red candle followed by a green candle that completely covers the previous candle's body. It shows a sudden shift in momentum. On EUR/USD at support, this is a strong buy signal.
2. Doji at Key Levels
A doji (open and close nearly equal) at a support or resistance zone means indecision. If it forms after a strong move, it often signals a reversal. On GBP/USD at 1.2700 resistance, a doji means sellers are stepping in.
3. Long Wicks (Rejection Candles)
A candle with a wick 2x longer than the body shows rejection. A long upper wick at resistance = sellers rejected higher prices. A long lower wick at support = buyers stepped in. These are your trade signals.
Quick tip: Open your chart right now. Find the last 3 candles on EUR/USD 1-hour where the wick is at least 2x the body. Mark them. Notice where they happened — at support or resistance. That's price action talking.
Common Mistakes When Learning How to Analyze Forex Market
Here's what most beginners do wrong — and how to fix it:
Mistake 1: Using too many indicators. Three moving averages, RSI, MACD, and Bollinger Bands on one chart. Result: conflicting signals. Fix: use 1-2 indicators max. Price action + one indicator is enough.
Mistake 2: Ignoring higher timeframes. You trade the 5-minute chart but don't check the 4-hour trend. Result: you buy in a downtrend. Fix: always check the 4-hour chart first. Trade in the direction of the higher timeframe trend.
Mistake 3: Chasing breakouts. Price breaks resistance, you buy. Price immediately reverses. Fix: wait for a retest of the breakout level before entering. If the level holds as support, then enter.
FAQ
How long does it take to learn how to analyze forex market?
You can learn the basics in 2-3 weeks of daily practice. Mastering it takes 6-12 months of consistent chart time. Focus on one pair (EUR/USD) and one timeframe (1-hour) until you're profitable.

Do I need fundamental analysis to trade forex?
No. Many successful traders use only technical analysis. But combining both gives you a stronger edge, especially for long-term trades. Start with technicals, add fundamentals later.
Which chart type is best for forex analysis?
Candlestick charts are the most popular because they show open, high, low, and close prices clearly. Line charts are useful for long-term trends. Bar charts (HLOC) work too, but candlesticks are easier to read.
What's the biggest mistake in forex market analysis?
Overcomplicating it. Beginners add 5 indicators and 10 drawing tools. The best traders use simple charts with clear support/resistance and 1-2 candlestick patterns. Simpler = more consistent.
Quick Recap
- Step 1: Identify market structure (trend vs range) on the 4-hour chart
- Step 2: Mark support and resistance zones, not single lines
- Step 3: Use 3 candlestick patterns: engulfing, doji, long wicks
- Step 4: Combine technical and fundamental analysis for better timing
- Step 5: Keep it simple — 1-2 indicators, one timeframe focus
Quick Win
Open your trading platform. Pull up EUR/USD on the 1-hour chart. Draw horizontal lines at the last 3 swing highs and 3 swing lows. Now draw a trendline connecting the most recent 2 swing lows. Is the trend up, down, or sideways? Write it down. Do this once a day for 7 days. By day 7, you'll see market structure without thinking.


