
What is the Head and Shoulders Pattern? (And Why Should You Care?)
You're scanning your charts. EUR/USD has been climbing for days. You're thinking about going long. But then you notice something strange — three peaks forming, like a silhouette of a person. The middle peak is taller. The other two are roughly the same height.
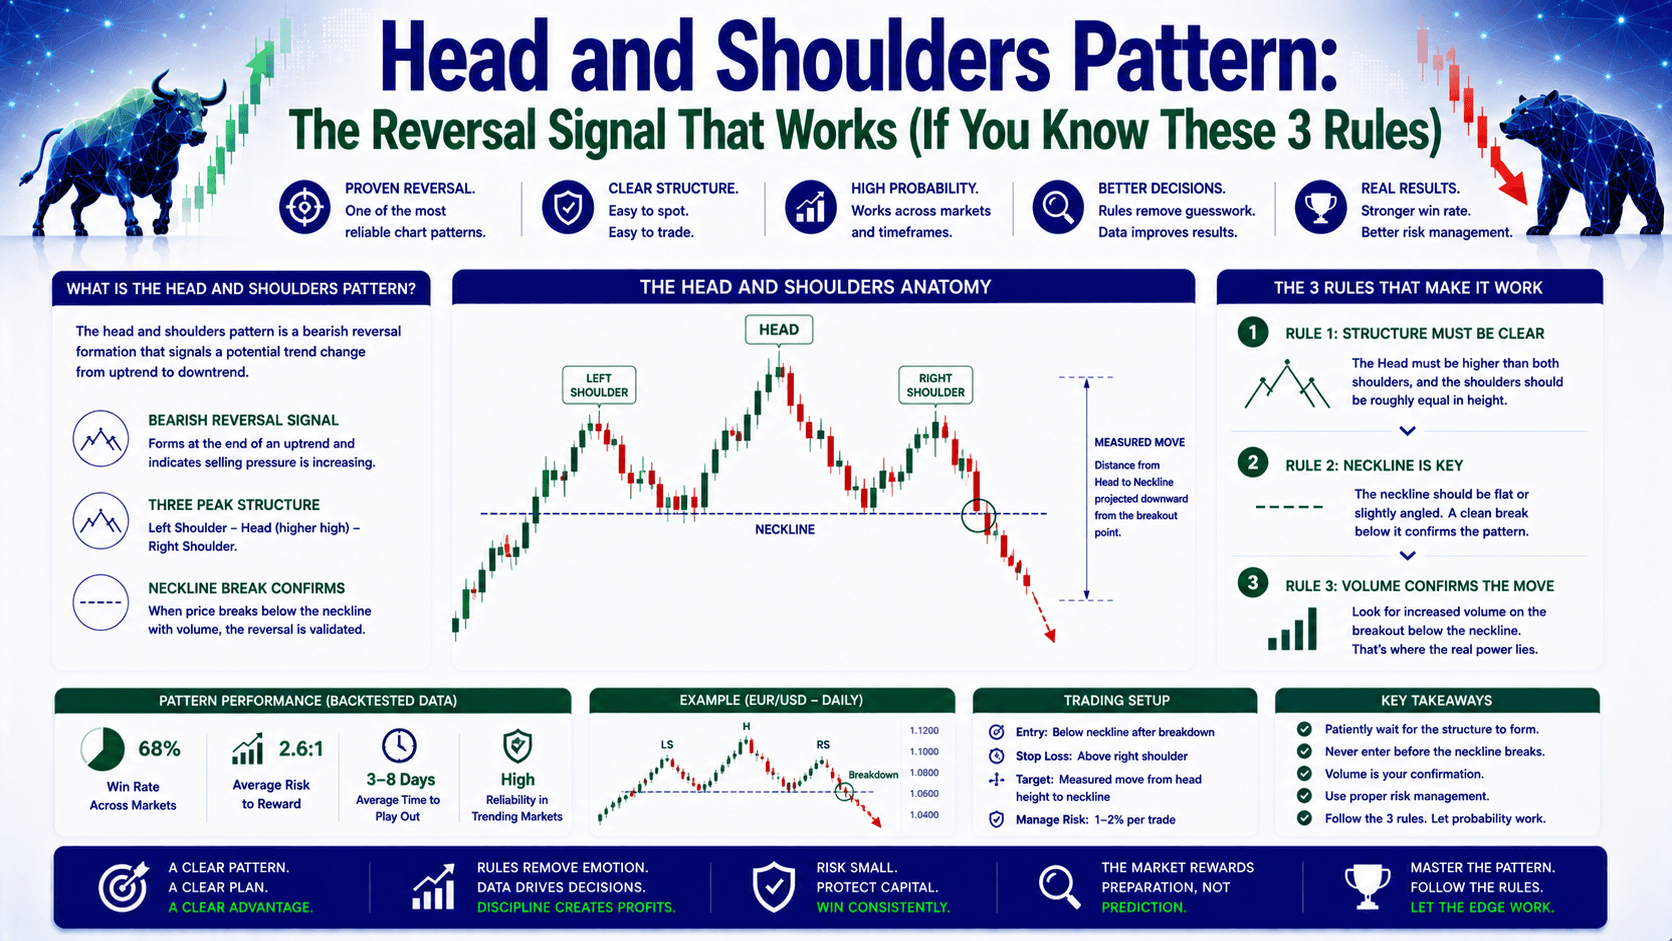
That's the head and shoulders pattern. And it's one of the most reliable reversal signals in forex trading.
Here's the deal: this pattern tells you that an uptrend is losing steam. Buyers are exhausted. Sellers are about to take control. If you can spot it early, you can catch the move before everyone else piles in.
How Does the Head and Shoulders Pattern Actually Form?
Let's walk through it step by step — with real numbers so you can see it happen.
Imagine EUR/USD is trading at 1.0850. Here's how the pattern develops:
Step 1: The Left Shoulder
Price rallies from 1.0850 to 1.0920. That's a 70-pip move. Then it pulls back to 1.0880. This first peak is your left shoulder. Volume is still high — buyers are confident.
Step 2: The Head
Price rallies again, this time pushing higher to 1.0980. That's 100 pips from the pullback low. This is the head. But here's the clue: volume is lower than during the left shoulder. Buyers are getting tired.
Step 3: The Right Shoulder
Price pulls back to 1.0900, then tries to rally one more time. This time it only reaches 1.0930 — well below the head's high. That's your right shoulder. Volume is even lower now. The party's over.
Step 4: The Neckline Break
You draw a line connecting the two pullback lows (1.0880 and 1.0900). That's the neckline. When price breaks below 1.0880 with conviction, the pattern is confirmed. Time to act.
The 3 Rules That Make the Head and Shoulders Pattern Work
Most beginners see three peaks and jump in. They get stopped out. Why? Because they ignore these rules.

Rule 1: Wait for the Neckline Break
The pattern is NOT confirmed until price breaks the neckline. Period. If you enter before the break, you're gambling.
Let's say you see the right shoulder forming at 1.0930. You think "it's going down" and short at 1.0920. Price drops to 1.0890, then reverses back to 1.0950. You're down 30 pips. Sound familiar?
Instead, wait for a clear close below the neckline. In our example, that's a close below 1.0880. Yes, you give up a few pips. But you also avoid the fake-out.
Rule 2: Set Your Stop Loss Above the Right Shoulder
Your stop loss goes above the right shoulder — not above the head. Why? Because if price breaks back above the right shoulder, the pattern is invalid.
Example: Right shoulder high = 1.0930. You enter short at 1.0875 (after neckline break). Your stop loss goes at 1.0940 (10 pips above the shoulder). That's a 65-pip stop. On 0.1 lots, that's $65 risk. Manageable if your account can handle it.
Rule 3: Measure the Target — Don't Guess
The target is calculated from the pattern's height. Here's the math:
Head high = 1.0980. Neckline at breakout = 1.0880. Height = 100 pips.
Subtract that from the breakout point: 1.0880 - 100 pips = 1.0780.
That's your target. On 0.1 lots, that's $100 profit. Risk: $65. Reward: $100. That's a 1:1.5 risk-reward ratio. Not bad.
Standard vs. Inverse Head and Shoulders Pattern
| Feature | Standard H&S | Inverse H&S |
|---|---|---|
| Signal | Bearish reversal | Bullish reversal |
| Where it forms | Top of an uptrend | Bottom of a downtrend |
| Head position | Highest peak | Lowest trough |
| Neckline break | Below neckline | Above neckline |
| Entry | Short after break | Long after break |
| Stop loss | Above right shoulder | Below right shoulder |
| Target calculation | Breakout minus height | Breakout plus height |
The data suggests the inverse pattern is slightly more reliable because it forms after prolonged selling, when sentiment is most extreme.
Common Mistakes That Cost Traders Money
Mistake 1: Trading a Pattern That's Not Complete
You see two peaks and think "head and shoulders!" But the right shoulder hasn't formed yet. You enter early. Price rallies to a new high. You're stopped out.
The fix: Wait for all three peaks AND the neckline break. Patience pays.
Mistake 2: Ignoring Volume
Volume should decline as the pattern forms. If volume is increasing on the right shoulder, the pattern is weaker. Sellers might not have enough conviction.
Check: On your platform, look at the volume indicator below the chart. If volume is higher on the right shoulder than the left, be cautious.
Mistake 3: Setting Stop Loss Too Tight
You enter at 1.0875. Your stop is at 1.0890 (15 pips). Price spikes to 1.0892 on a news release, takes your stop, then drops to 1.0780. You missed 92 pips of profit.
The fix: Give the trade room. A stop above the right shoulder is standard. If that's too wide for your account, reduce your lot size.
Combining the Head and Shoulders Pattern with RSI
The RSI (Relative Strength Index) adds a second layer of confirmation.
How it works:
- During the head formation, check if RSI is above 70 (overbought). This confirms buyer exhaustion.
- When the right shoulder forms, RSI should be below 50. This shows momentum has shifted to sellers.
- A neckline break with RSI below 50 is a high-probability setup.
Example: EUR/USD head forms at 1.0980. RSI is at 72. Right shoulder at 1.0930. RSI is at 45. Neckline breaks at 1.0880. RSI is at 38. That's three confirmations. The probability of a successful trade just went up.
FAQ
Is the head and shoulders pattern reliable?
Yes, it's one of the most reliable reversal patterns. But no pattern works 100% of the time. Always use a stop loss and manage risk.

Can the head and shoulders pattern be bullish?
Yes. The inverse head and shoulders pattern signals a bullish reversal. It forms at the bottom of a downtrend with three troughs — the middle one being the lowest.
What timeframe is best for the head and shoulders pattern?
Higher timeframes (1-hour, 4-hour, daily) produce more reliable signals. Lower timeframes have more noise and false breakouts.
How do I calculate the target for the head and shoulders pattern?
Measure the vertical distance from the head's peak to the neckline. For a standard pattern, subtract this from the breakout point. For an inverse pattern, add it.
Quick Recap
- The head and shoulders pattern signals a bearish reversal after an uptrend
- Wait for the neckline break before entering — don't jump in early
- Set your stop loss above the right shoulder, not above the head
- Calculate your target using the pattern's height
- Use RSI and volume for additional confirmation
Quick Win
Open your chart right now. Pull up EUR/USD on the 4-hour timeframe. Scroll back through the last 2 weeks. Can you find any three-peak formations? Draw the neckline connecting the two troughs. If price has broken below it, you've spotted a head and shoulders pattern. If not, keep looking. The more you practice, the faster you'll see it in real-time.


