
Why Most Traders Miss The Big Reversals
You've been there. Price hits a level, you think it's going to reverse, you enter, and it keeps going. Or worse — you watch a perfect reversal happen without you, because you had no way to spot it in advance.
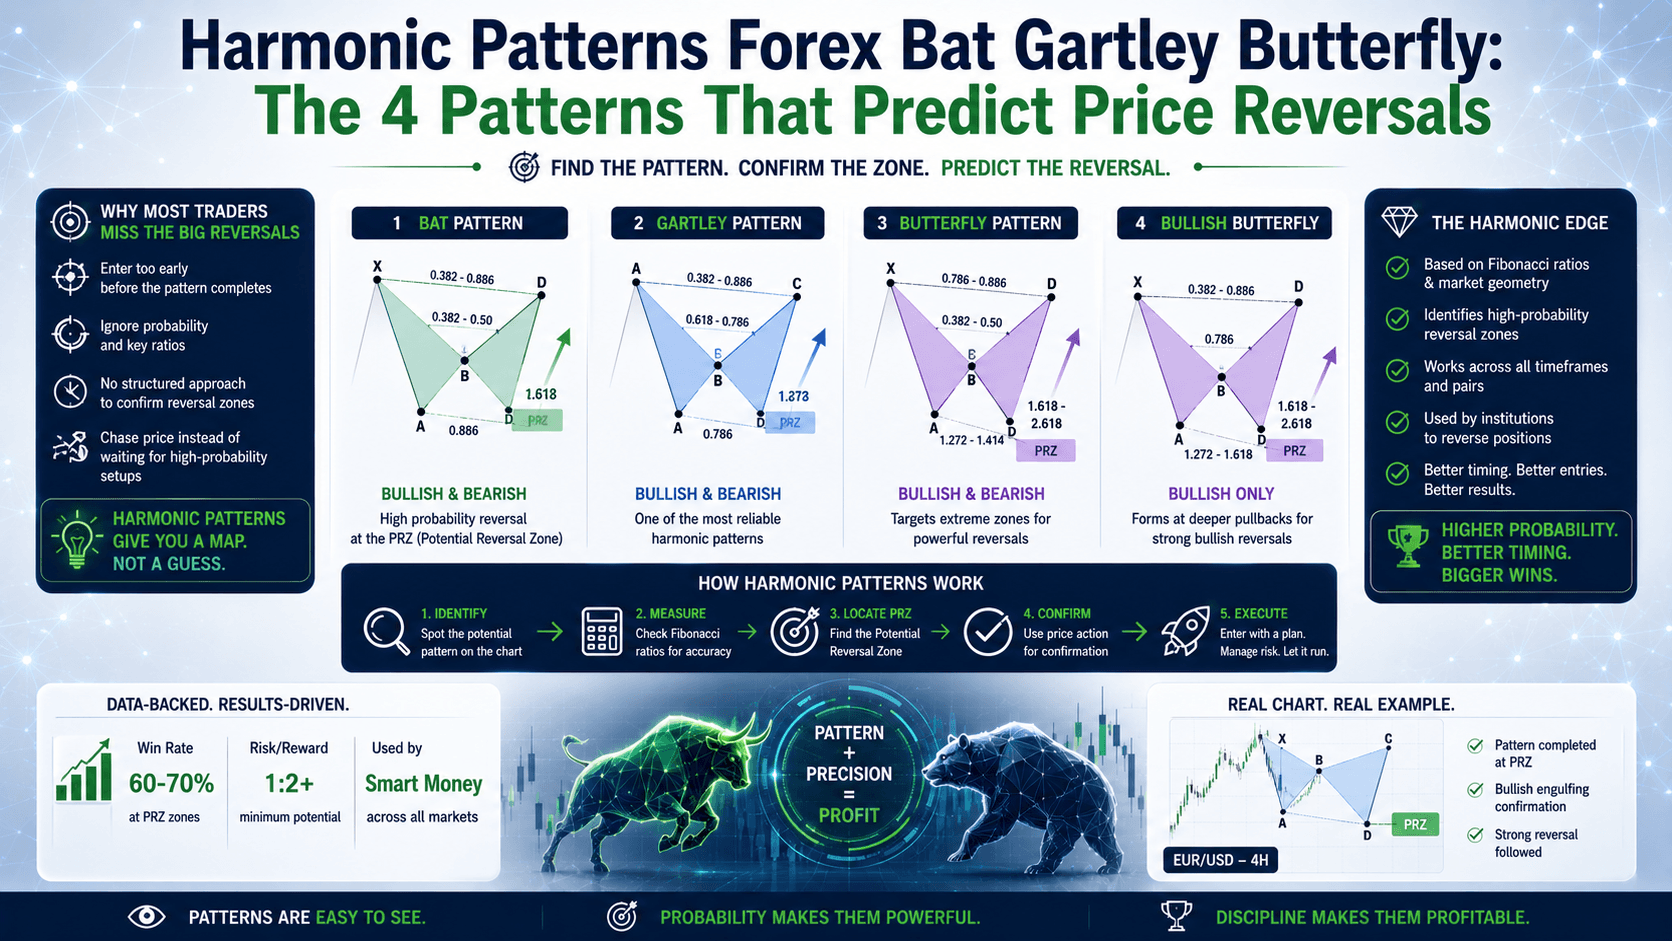
The difference between catching that reversal and getting stopped out often comes down to one thing: harmonic patterns. These aren't your typical flag or triangle patterns. They're precise geometric structures based on Fibonacci ratios that tell you exactly where price is likely to reverse — and where to put your stop.
Let's break down the four most important harmonic patterns forex bat gartley butterfly traders use to find high-probability reversal zones.
What Are Harmonic Patterns in Forex?
Harmonic patterns are chart formations that use specific Fibonacci retracement and extension ratios between price swings. Unlike classical patterns (head and shoulders, triangles), harmonic patterns give you exact entry and exit levels.
Each pattern has five key points: X, A, B, C, and D. The distance between these points must hit precise Fibonacci ratios — usually 38.2%, 50%, 61.8%, 78.6%, 127.2%, or 161.8%. If the ratios are off by more than a few percentage points, the pattern is invalid.
Here's the key: you enter at point D, expecting a reversal back toward point C or beyond. Your stop goes just past D. Your target is the C point or the 0.618 retracement of CD.
The 4 Core Harmonic Patterns: Bat, Gartley, Butterfly, and ABCD
Let's compare the four patterns you need to know. The table below shows the critical Fibonacci ratios for each.
| Pattern | B Point (Retracement of XA) | D Point Entry | Key Feature |
|---|---|---|---|
| Gartley | 0.618 of XA | 0.786 of XA | Classic reversal, moderate depth |
| Bat | 0.382–0.500 of XA | 0.886 of XA | Tighter stops, higher R:R |
| Butterfly | 0.786 of XA | 1.272–1.618 extension of XA | Deep extension, trend reversal |
| ABCD | 0.618 of AB | AB = CD (equal legs) | Simplest pattern, 4 points only |
Harmonic Patterns Bat Gartley Butterfly: How Each One Works
The Gartley Pattern — The Original
Discovered by H.M. Gartley in 1935, this is the grandfather of all harmonic patterns. It has five points (XABCD) and follows two strict rules:

- Point B must retrace exactly 61.8% of the XA leg
- Point D must retrace 78.6% of XA
Real example: EUR/USD at 1.0850. You see a swing from X (1.0800) to A (1.0900) — that's 100 pips. Price pulls back to B at 1.0838 (61.8% of 100 pips = 61.8 pips down from 1.0900). Then it moves to C and finally D at 1.0821 (78.6% retracement of XA). You go long at 1.0821 with a stop at 1.0800 (21 pip risk). Target: 1.0880 (59 pips). That's a 1:2.8 risk-reward ratio.
The Bat Pattern — Tighter Stops, Better R:R
Discovered by Scott Carney in 2001, the Bat pattern is known for its tight stop losses. The key difference: point B retraces only 38.2% to 50% of XA, and point D hits a deep 88.6% retracement.
Real example: GBP/USD at 1.2650. XA leg runs 150 pips. Point B retraces 50% (75 pips) to 1.2725. After C, point D hits 0.886 of XA — that's 132.9 pips from A, putting D at 1.2521. You go long at 1.2521 with a stop at 1.2500 (21 pips). Target: 1.2650 (129 pips). That's a 1:6 risk-reward.
Most practitioners consider the Bat the most reliable harmonic pattern because the tight stop at D gives you a better probability of being right — you're not waiting for a massive extension.
The Butterfly Pattern — Trend Reversals at Extremes
Discovered by Bryce Gilmore, the Butterfly pattern is unique because point D extends beyond point X. This makes it a deep reversal pattern, often signaling the end of a major trend.
- Point B must retrace 78.6% of XA
- Point D extends 127.2% to 161.8% of XA
Real example: Gold (XAU/USD) at $2,350. XA leg runs from $2,300 to $2,400 (100 points). Point B retraces 78.6% to $2,321. After C, point D extends 161.8% of XA — that's $2,300 minus 61.8 points = $2,238. You go long at $2,238 with a stop at $2,220 (18 points). Target: $2,350 (112 points). That's a 1:6.2 risk-reward.
The ABCD Pattern — The Foundation
This is the simplest harmonic pattern with only four points (no X). The rule: AB and CD must be equal in length, and BC must retrace 61.8% of AB.
Real example: USD/JPY at 150.00. AB runs from 150.00 to 151.00 (100 pips). BC retraces 61.8% to 150.38. CD then extends 100 pips from C to 151.38. You short at 151.38 with a stop at 151.50 (12 pips). Target: 150.38 (100 pips).
How to Trade Harmonic Patterns: A Step-by-Step Framework
Step 1: Identify the Swing Points
Look for clear swing highs and lows on your chart. The higher timeframe (1-hour, 4-hour, daily) usually produces cleaner patterns than 5-minute charts.
Step 2: Apply Fibonacci Retracement and Extension Tools
- Draw the retracement tool from X to A to find B
- Draw the extension tool from A to B to find C
- Draw the retracement tool from X to A again to find D
Step 3: Verify the Ratios
Each leg must hit its target ratio within ±3 percentage points. If B is at 55% instead of 61.8%, the pattern is invalid. Don't force it.
Step 4: Wait for Confirmation at D
Don't enter the moment price hits the Fibonacci level. Wait for a reversal candle — a hammer, bullish engulfing, or pin bar at D. This is your trigger.
Step 5: Set Stops and Targets
- Stop loss: 5-10 pips past point D
- First target: 38.2% retracement of CD
- Second target: Point C
- Final target: 61.8% retracement of CD
Common Mistakes That Kill Harmonic Trades
Here's the trap most beginners fall into — and the fix.
| Mistake | Why It Hurts | The Fix |
|---|---|---|
| Forcing patterns on every swing | Low win rate, poor R:R | Wait for textbook ratios only |
| Entering at the Fibonacci level without confirmation | Price blows through D | Wait for a reversal candle first |
| Trading against the higher-timeframe trend | Strong trend overrides the reversal | Only take harmonic trades in the direction of the daily trend |
| Ignoring market context (news, volatility) | Pattern invalidated by external events | Check economic calendar before each trade |
Why Harmonic Patterns Work (And When They Don't)
Harmonic patterns work because enough traders watch these Fibonacci levels and place orders there. When you get confluence — a Fib ratio at D, a prior swing high/low at D, and a round number at D — the probability of a clean reversal rises significantly.
They stop working when price blows through the D point without hesitation. This usually means the market structure has flipped — you're trading against a stronger trend. Three rules that reduce harmonic losses:
- Don't force patterns. If the ratios aren't clean, there is no pattern.
- Trade with the higher-timeframe trend. A Bat long in a confirmed daily uptrend is much more reliable than the same Bat long inside a daily downtrend.
- Use confirmation at D. A reversal candle is the trigger, not the Fib ratio alone.
FAQ
What is the most reliable harmonic pattern?
Most traders consider the Bat pattern the most reliable because its 0.886 D-point entry produces tighter stops and cleaner risk-reward ratios than deeper Butterfly or Crab setups.

Can you use harmonic patterns on any timeframe?
Yes, but higher timeframes (1-hour, 4-hour, daily) produce cleaner patterns with less noise. Very short timeframes (1-5 minutes) have too much random price movement for precise ratios.
Do I need special software to find harmonic patterns?
No. You can identify them manually with a Fibonacci retracement and extension tool. Pattern scanners exist but often flag loose fits — visual confirmation is still required.
How accurate are harmonic patterns?
When ratios are precise and confirmation is required at D, clean harmonic setups tend to produce favorable risk-reward even when win rates are moderate (45-55%). The edge comes from tight stops at the D swing.
📝 Quick Recap
- Harmonic patterns use precise Fibonacci ratios between price swings (XABCD) to predict reversals
- The four core patterns are Bat, Gartley, Butterfly, and ABCD — each with specific ratio requirements
- Enter at point D after a confirmation candle, stop just past D
- The Bat pattern offers the tightest stops and best risk-reward ratios
- Always trade with the higher-timeframe trend for higher probability
- Don't force patterns — if ratios aren't clean, skip the trade
⚡ Quick Win
Open your chart right now. Pull up EUR/USD on the 4-hour timeframe. Look for the last three clear swing highs and swing lows. Apply the Fibonacci retracement tool from the lowest swing low to the highest swing high. Check if any of the retracement levels (38.2%, 50%, 61.8%, 78.6%) line up with a swing point. If they do, you've found a potential harmonic leg. Start building your pattern recognition — it's the fastest way to get comfortable with these setups.


