
Here's the Problem With Most Trading Strategies
You spend hours analyzing charts. You draw support and resistance. You check the RSI, the MACD, the moving averages. You finally enter a trade. And then — the market does the exact opposite of what you expected.
Sound familiar?
The thing is, nobody can predict where price will go next. Not you, not me, not the guy selling $500 courses on Instagram. The market moves on news, sentiment, and algorithms that change faster than you can blink.
So what if there was a strategy that didn't require you to predict direction at all?
That's exactly what grid trading strategy does. And in this guide, I'm going to show you exactly how it works — with real numbers, real examples, and the mistakes that will blow up your account if you're not careful.
What Is Grid Trading? (The Simple Version)
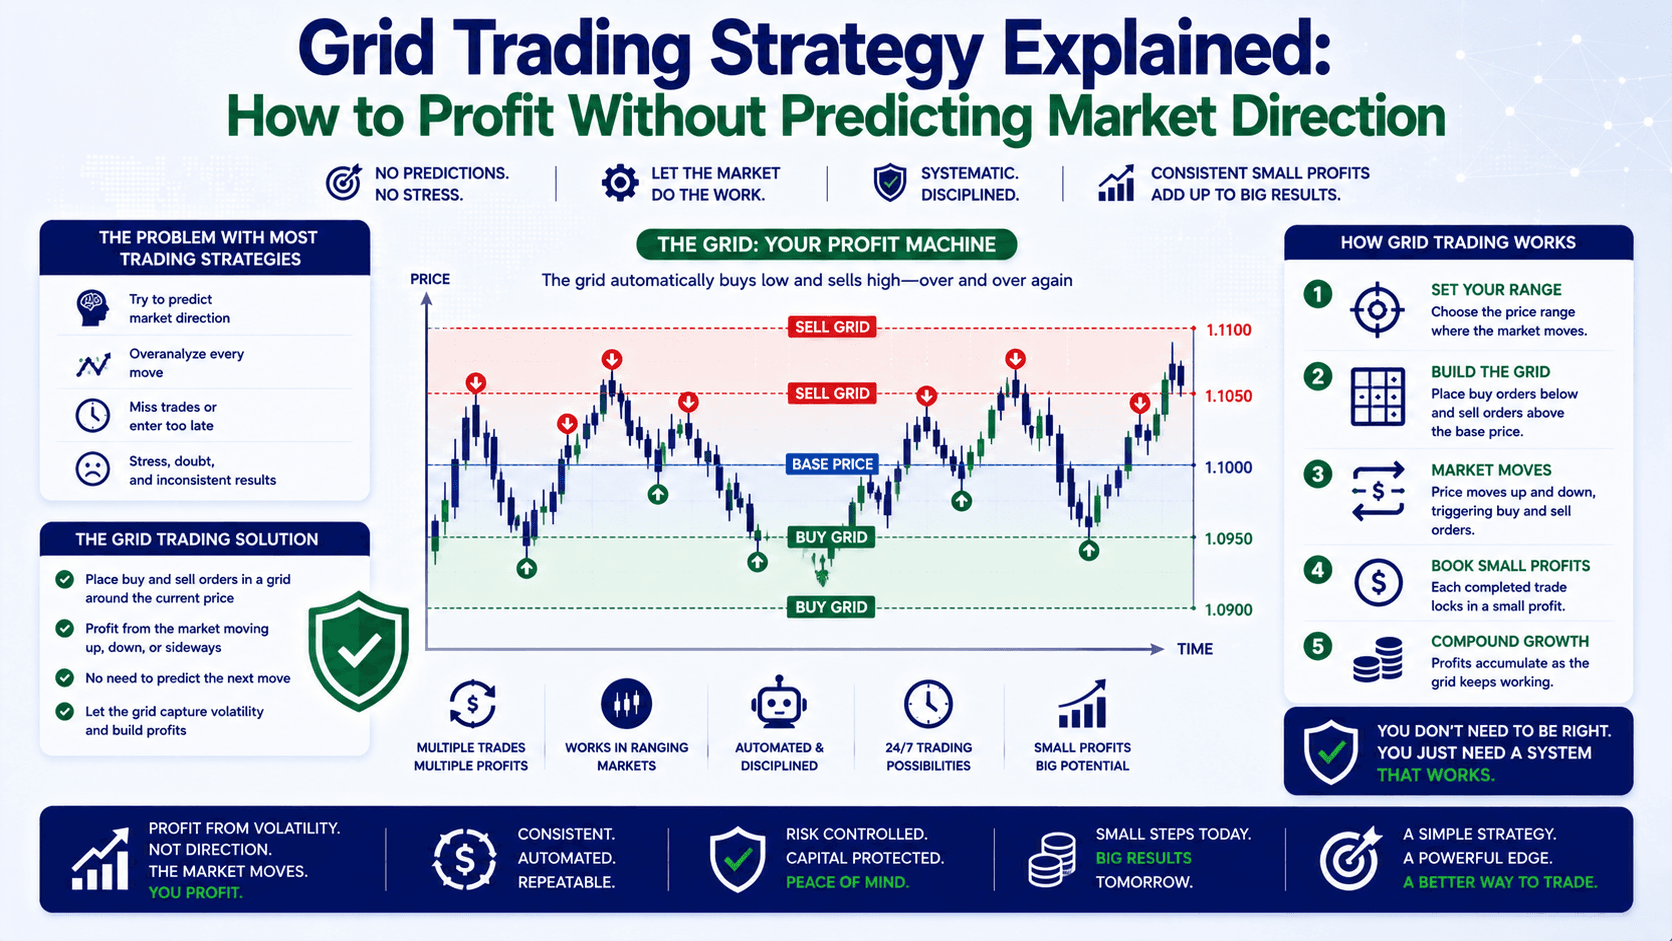
A grid trading strategy is a systematic approach where you place multiple buy and sell orders at fixed price intervals above and below a base price. These intervals form a "grid" on your chart.
Here's the key: you don't care which way price goes. You profit from the movement itself — the oscillation.
Think of it like a fishing net. Instead of trying to catch one specific fish (predicting direction), you cast a net across the whole area. When fish swim through, you catch them. When they swim back, you catch them again.
Let me show you with real numbers.
A Real Example on EUR/USD
EUR/USD is trading at 1.0850. You set up a grid with 20-pip intervals:
- Sell order at 1.0870 — TP at 1.0850
- Sell order at 1.0890 — TP at 1.0870
- Buy order at 1.0830 — TP at 1.0850
- Buy order at 1.0810 — TP at 1.0830
Price drops to 1.0810. Your buy orders at 1.0830 and 1.0810 both trigger. Price then bounces back to 1.0850. Both buy orders close in profit — 40 pips total.
You didn't predict the drop. You didn't predict the bounce. You just set up the grid and let the market do the work.
That's the beauty of it.
The 3 Types of Grid Trading Strategies
Not all grids are created equal. Here are the three main approaches, and when to use each one.
1. Range Grid (For Sideways Markets)
This is the classic setup. You place buy orders near support and sell orders near resistance. As price bounces between these levels, you capture profits on each swing.
Best for: EUR/USD, GBP/USD, USD/CHF during low-volatility sessions (Asian session, quiet summer months).
Risk: If price breaks out of the range, you'll have multiple losing positions on one side.
2. Trend-Following Grid (For Directional Markets)
You only place orders in the direction of the trend. In an uptrend, you place buy orders below current price. Each dip triggers a buy, and each rally books profit.
Best for: Strong trending pairs like USD/JPY or GBP/JPY.
Risk: If the trend reverses, you're buying into a decline.
3. Hedged Grid (For Advanced Traders)
You place both buy and sell orders at every grid level. Profitable trades close at the next level, while losing trades are held until price swings back.
Best for: Experienced traders who understand margin management.
Risk: Very capital-intensive. Requires precise calculation.
Grid Trading vs. Martingale — The Critical Difference
I see traders confuse these two all the time. They are not the same thing.

| Aspect | Grid Trading | Martingale |
|---|---|---|
| Position sizing | Consistent lot size | Doubles after each loss |
| Risk profile | Gradual drawdown | Exponential risk growth |
| Capital requirement | Calculable in advance | Theoretically infinite |
| Recovery method | Multiple small wins | Single large win |
| Account blow-up risk | Lower but still present | Very high |
Bottom line: Grid trading uses consistent lot sizes. Martingale doubles down after losses. If you see a "grid martingale" system, run the other way.
The $1,100 Problem — What Most Grid Trading Guides Don't Tell You
Here's where the pain comes in. Grid trading works beautifully in ranging markets. But when a strong trend hits, losses can pile up fast.
Let me show you with real numbers.
The Drawdown Scenario
You set up a 10-level grid on EUR/USD with 20-pip spacing and 0.1 lots per level. That's $1 per pip per level.
Price drops through all 10 levels without retracing:
- Level 1: -20 pips ($20 loss)
- Level 2: -40 pips ($40 loss)
- Level 3: -60 pips ($60 loss)
- ...all the way to Level 10: -200 pips ($200 loss)
Total floating loss: $1,100
And that's just a 200-pip move. Major news events can move EUR/USD 200+ pips in hours. A sustained trend can run 500+ pips over days.
This is why capital management is everything.
How Much Capital Do You Actually Need?
| Grid Levels | Spacing | Lot Size | Max Drawdown | Recommended Capital |
|---|---|---|---|---|
| 5 levels | 20 pips | 0.01 | $55 | $500+ |
| 10 levels | 20 pips | 0.01 | $110 | $1,000+ |
| 10 levels | 20 pips | 0.1 | $1,100 | $10,000+ |
| 20 levels | 30 pips | 0.1 | $6,300 | $25,000+ |
Rule of thumb: Your account should survive maximum drawdown with at least 50% equity remaining.
Risk Management — The 5 Rules You Must Follow
Grid trading without risk management is just gambling with extra steps. Here's how to protect yourself.
1. Set a Maximum Drawdown Stop
Decide in advance: at what point do you close all positions and accept the loss? Most professionals use 25-30% of account equity.
Example: You have a $10,000 account. When floating losses hit $2,500, you close everything. No exceptions.
2. Use Trend Filters
Don't run a grid in a strong trend. Use a 200-period moving average or ADX indicator to filter out trending conditions.
Simple rule: Only run the buy grid if price is above the 200-SMA. Only run the sell grid if price is below it. Pause entirely if ADX is above 30.
3. Choose the Right Pairs
Some pairs are structurally better for grid trading:
- Good: EUR/CHF, AUD/NZD, EUR/GBP (historically range-bound)
- Avoid: USD/JPY, GBP/JPY, emerging market pairs (strong trending tendencies)
4. Manage Correlation
Running grids on EUR/USD and GBP/USD at the same time? You're doubling your USD exposure. If the dollar strengthens, both grids get hit simultaneously.
Fix: Run one grid at a time, or use uncorrelated pairs like EUR/USD and USD/CHF.
5. Account for Swap Costs
Holding multiple positions overnight adds up. If your grid has 10 open positions, that's 10x the swap cost every day.
Check: Calculate weekly swap costs before deploying. If they eat more than 20% of your expected profits, the strategy won't work.
Step-by-Step: Setting Up Your First Grid
Ready to try it? Here's exactly how to set up a low-risk grid on EUR/USD.
Step 1: Choose Your Timeframe
H4 or H1 works best. Balances signal frequency with margin requirements.
Step 2: Define Grid Parameters
- Base price: Current EUR/USD mid (e.g., 1.0850)
- Interval: 30 pips (use ATR to confirm)
- Levels: 3 buys below, 3 sells above
Step 3: Calculate Position Size
Account: $5,000. Risk 1% per full grid = $50 max risk.
Max open orders: 6. Each order: $50 ÷ 6 = $8.33 risk → approximately 0.01 lots.
Step 4: Set Take Profit
Each order's TP equals the grid interval (30 pips). No stop loss on individual orders — risk is managed at the account level.
Step 5: Deploy and Monitor
Run on a demo account first for at least 3 months. Track maximum drawdown, win rate, and swap costs.
Pro tip: Use a VPS (Virtual Private Server) to keep your grid running 24/7. Your home computer will crash, restart, or lose internet at the worst possible moment.
FAQ
Is grid trading profitable?
It can be, in ranging markets with proper risk management. But it's not a guaranteed profit machine. Long-term profitability depends on pair selection, position sizing, and surviving drawdowns.

How much money do I need for grid trading?
For a small 5-level grid with 0.01 lots, you need at least $500. For a full 10-level grid with 0.1 lots, you need $10,000+. Never trade a grid you can't fully fund.
Does grid trading work without a stop loss?
Traditional grid trading doesn't use per-position stop losses. But you must have an account-level maximum drawdown stop — typically 25-30% of equity.
What's the best currency pair for grid trading?
EUR/USD is the most popular choice due to its liquidity and tendency to range. EUR/CHF and AUD/NZD are also good candidates. Avoid trending pairs like USD/JPY.
Quick Recap
- Grid trading profits from price oscillation without predicting direction
- Three types: Range grid, trend-following grid, hedged grid
- Biggest risk: Strong trends can cause $1,000+ drawdowns on a 10-level grid
- Risk management: Set a 25-30% max drawdown stop, use trend filters, choose range-bound pairs
- Capital needed: $500 minimum for small grids, $10,000+ for full setups
Your Quick Win
Open your MT4 or MT5 platform right now. Pull up EUR/USD on the H4 chart. Draw horizontal lines every 30 pips from the current price — 3 lines above, 3 lines below. That's your grid.
Now look at the last 50 candles. How many times did price cross through 3 or more grid levels? That's how often your grid would have captured profits.
Do this for 5 different currency pairs. You'll quickly see which ones are grid-friendly and which ones aren't.


