
Ever opened two separate trades, thinking you were being smart and diversified, only to watch both of them hit their stop losses at the exact same time?
Yeah, I've been there. It's a terrible feeling.
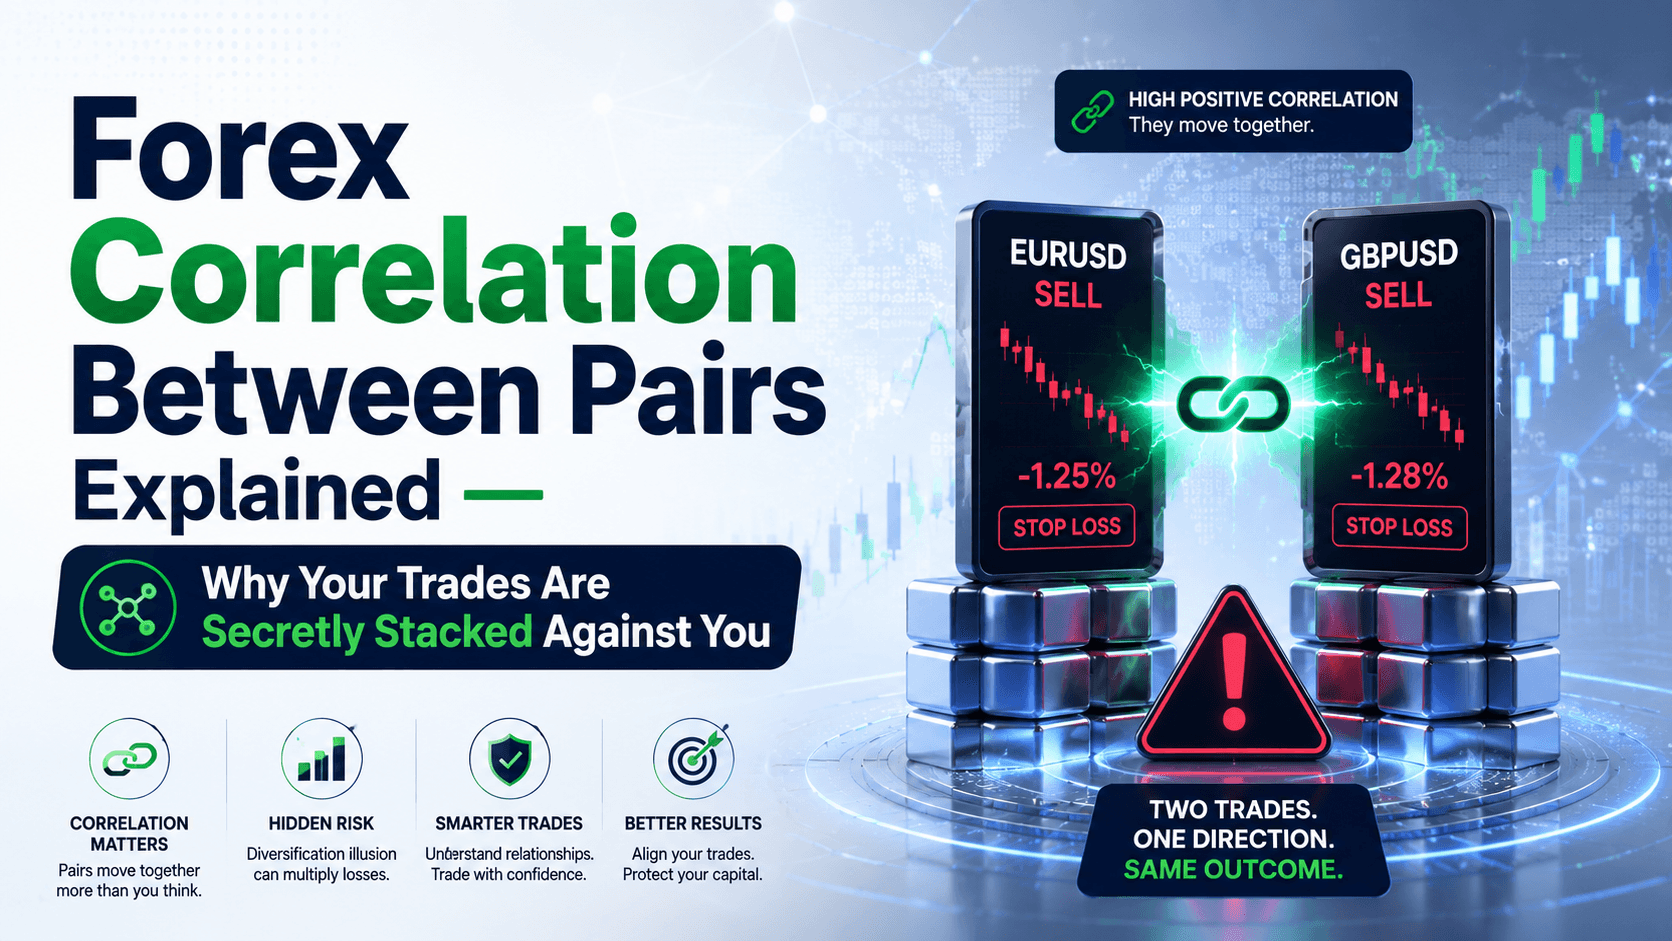
You thought you were spreading risk. But in reality, you just doubled down on the same bet without realizing it. That's the hidden danger of forex correlation between pairs — and why understanding it can save your account.
Here's the deal: currency pairs don't move in isolation. They're connected. Some move together like best friends. Others move in opposite directions like rivals. And a few just do their own thing entirely.
Knowing who moves with who is a superpower. It helps you avoid accidental double exposure, build smarter hedges, and even find better trade opportunities.
Let's break it down — with real numbers and real trades.
What is Forex Correlation Between Pairs? (The Simple Version)
Forex correlation between pairs explained in plain English: it's a way to measure how two currency pairs move in relation to each other.
We use a number called the correlation coefficient. It ranges from -1 to +1:
- +1 = Perfect positive correlation. They move in the same direction, almost every time.
- -1 = Perfect negative correlation. One goes up, the other goes down.
- 0 = No correlation. They move independently.
Think of it like two dancers. Some dance in perfect sync. Others step in opposite directions. And some are just dancing to completely different songs.
Now, why does this matter to you? Because if you're trading multiple pairs without checking correlation, you might be stacking risk instead of spreading it.
The Trap Most Beginners Fall Into
Let me show you a scenario that happens every single day.
You open your chart. You see a nice setup on EUR/USD at 1.0850. You go long with 0.1 lots, stop at 1.0820 (30 pip risk).
Then you see another setup on GBP/USD at 1.2620. You go long with 0.1 lots, stop at 1.2590 (30 pip risk).
You think: "Great, I've got two different trades. Diversification!"
But here's the problem. EUR/USD and GBP/USD have a strong positive correlation — around +0.95. That means when one goes up, the other almost always goes up too. And when one drops, the other follows.
So what did you actually do? You placed two bets on the same thing.
Your total risk? Instead of 30 pips × $1.00/pip = $30 on one trade, you're risking 30 pips × $1.00/pip × 2 trades = $60.
And if both hit their stops? That's $60 gone instead of $30. You didn't diversify. You just doubled your exposure.
Sound familiar? That's the trap.
Common Forex Correlation Pairs You Need to Know
Here are the relationships you'll see most often. Memorize these:

| Pair A | Pair B | Correlation | Type |
|---|---|---|---|
| EUR/USD | GBP/USD | +0.95 | Strong Positive |
| EUR/USD | USD/CHF | -0.95 | Strong Negative |
| AUD/USD | NZD/USD | +0.95 | Strong Positive |
| USD/CAD | AUD/USD | -0.85 | Strong Negative |
| EUR/JPY | GBP/JPY | +0.90 | Strong Positive |
| USD/CHF | GBP/CHF | +0.90 | Strong Positive |
These aren't set in stone. Correlations can shift over time due to economic news, central bank policies, or global events. But these are the most common relationships you'll encounter.
The Wrong Way vs. The Right Way to Use Correlation
Let's contrast two approaches.
The Wrong Way (What Most Beginners Do)
Open EUR/USD long and GBP/USD long at the same time. Both are positively correlated. You think you're diversified. But you're actually just doubling your risk on the same directional bet.
The Right Way (What Smart Traders Do)
Use correlation to balance your portfolio. For example:
- Go long EUR/USD (0.1 lots) — bullish on EUR
- Go long USD/CHF (0.1 lots) — also bullish on USD, but this pair moves opposite to EUR/USD
Wait — doesn't that cancel out? Not exactly.
Because EUR/USD and USD/CHF have a strong negative correlation, going long on both means:
- If EUR/USD goes up, you profit on that trade, but USD/CHF likely drops (small loss)
- If EUR/USD goes down, you lose on that trade, but USD/CHF likely rises (small profit)
The result? Your portfolio is hedged. You're not betting on direction. You're betting on volatility or waiting for a clearer signal.
But here's the real pro move: use the pip value difference to your advantage.
On EUR/USD, 1 pip on a standard lot (100,000 units) is worth $10. On USD/CHF, 1 pip on the same lot size is worth about $9.24 (because CHF is a different currency).
So if you short EUR/USD and short USD/CHF (both bearish on the dollar), and EUR/USD drops 10 pips, you make $100. But if USD/CHF rises 10 pips (because of the negative correlation), you lose $92.40. Net profit: $7.60. Not huge, but it's a hedge that protects you if the move reverses.
That's the power of understanding correlation. You're not just trading pairs — you're trading the relationship between them.
How Correlation Can Confirm (or Kill) Your Trade Idea
Here's another way to use forex correlation between pairs explained as a tactical tool.
Say you see a breakout on EUR/USD. Price breaks above resistance at 1.0880 with strong momentum. You're ready to go long.
But before you click buy, check GBP/USD. If GBP/USD is also breaking out in the same direction, that's confirmation. The move has broader support.
But if GBP/USD is stalling or pulling back? That's a red flag. The EUR/USD breakout might be a fakeout. Wait for confirmation.
This simple check can save you from entering a bad trade. It's like having a second opinion from the market itself.
How to Calculate Correlation Yourself (It's Easier Than You Think)
You don't need to be a math wizard. Just use a spreadsheet.
- Download daily price data for two pairs (e.g., from your broker or a free charting site).
- Put the data in two columns in Excel or Google Sheets.
- Use the formula:
=CORREL(A1:A50, B1:B50)— where A and B are your two columns of price data. - The result is your correlation coefficient.
I'd recommend checking correlations over 1 month, 3 months, and 6 months. Short-term correlations can be noisy. Longer-term gives you the real picture.
Update it every few weeks. Correlations change, especially around major news events like NFP or central bank meetings.
FAQ
Which forex pairs are most correlated?
EUR/USD and GBP/USD have the strongest positive correlation (around +0.95). EUR/USD and USD/CHF have the strongest negative correlation (around -0.95).

What forex pairs are not correlated?
Pairs from different regions with different drivers, like GBP/JPY and USD/CAD, often have weak or no correlation. They're useful for diversification.
How often do currency correlations change?
They can shift daily due to news, but major relationships tend to hold over weeks and months. Check every few weeks or after major economic events.
Can I use correlation to hedge my trades?
Yes. Trading negatively correlated pairs (like long EUR/USD and long USD/CHF) can offset risk. But remember, it also caps your profits. Use it for protection, not for profit maximization.
📝 Quick Recap
- Forex correlation between pairs explained measures how two currency pairs move together (positive) or opposite (negative).
- Don't trade highly correlated pairs in the same direction — you're just doubling risk.
- Use negative correlation to hedge your portfolio and reduce drawdowns.
- Check GBP/USD when trading EUR/USD for confirmation or warning signals.
- Calculate your own correlations in a spreadsheet every few weeks.
Quick Win — Do This in 5 Minutes
Open your trading platform right now. Pull up EUR/USD and GBP/USD on the same chart or side by side. Look at the last 20 candles on the 1-hour timeframe. Notice how often they move in the same direction. That's correlation in action. Now check EUR/USD and USD/CHF — see the difference?
Once you see it with your own eyes, you'll never look at your trade list the same way again.


