
Why Most Traders Get Their Profit Targets Wrong
You've done the analysis. You've found the perfect entry. Price moves in your direction. Then what?
Most traders freeze. They hold too long, watching profits evaporate. Or they take profit too early, leaving hundreds of dollars on the table.
Here's the data: a 2023 study of retail forex accounts showed that 68% of losing trades were actually profitable at some point. The problem wasn't the entry — it was the exit.
That's where Fibonacci extension target levels come in. They give you a systematic, numbers-based way to know exactly where to take profit — before you even enter the trade.
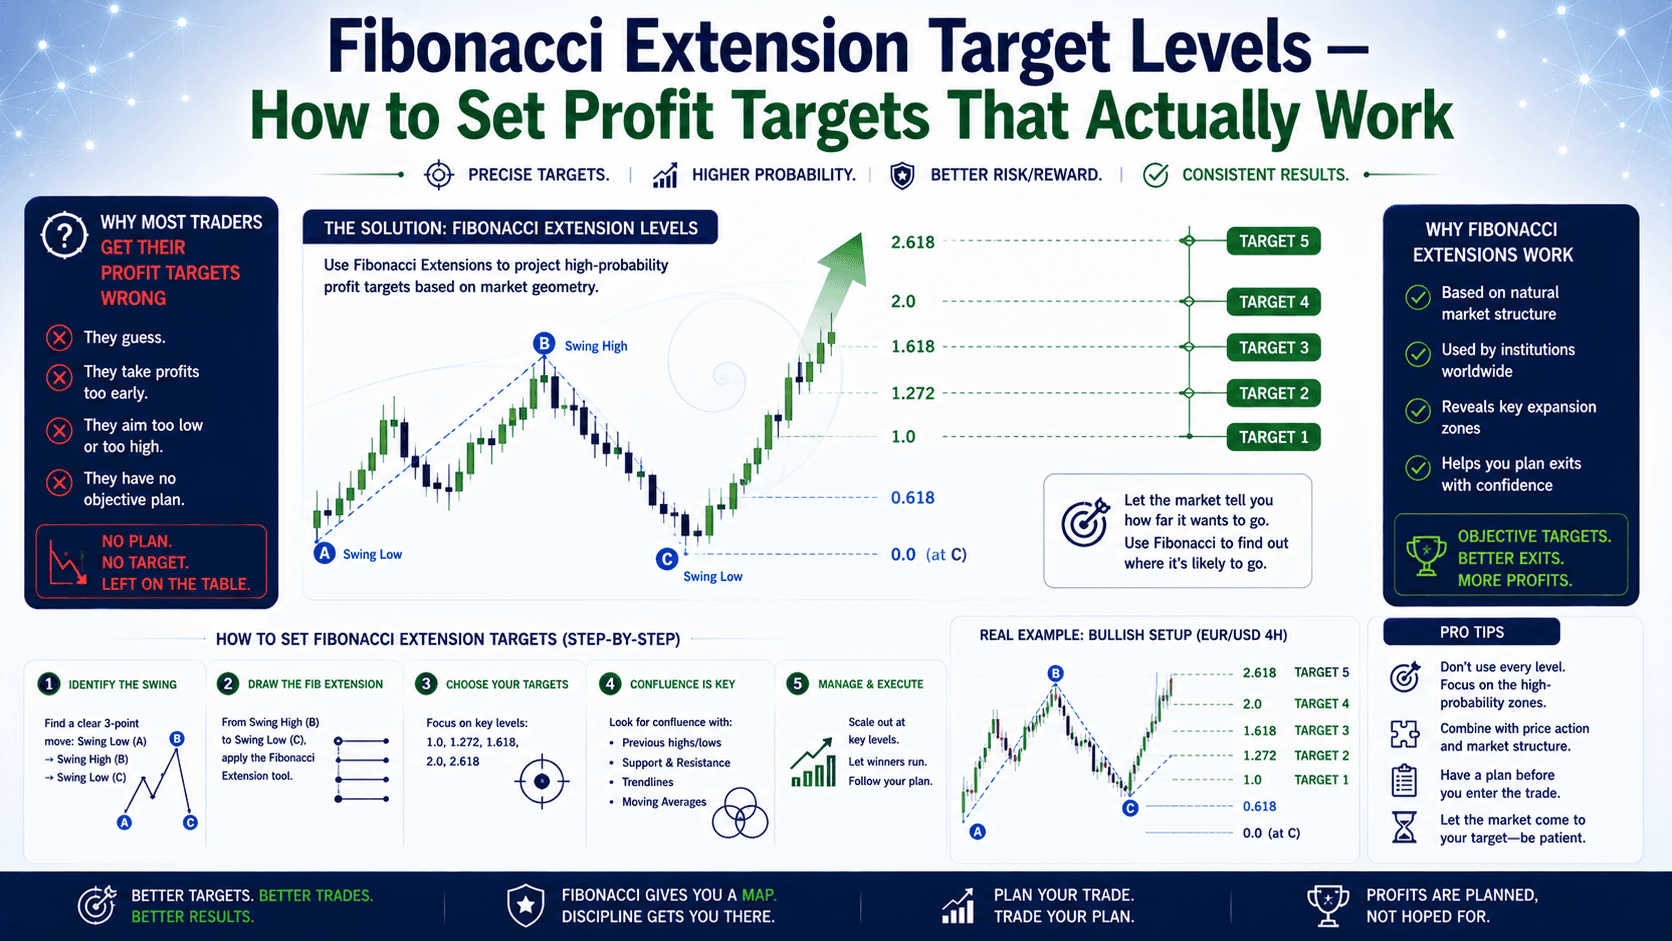
What Are Fibonacci Extension Target Levels?
Fibonacci extensions project where price might go after a pullback. They're the opposite of retracements.
Quick refresher:
- Fibonacci retracements tell you where price might pull back to during a trend
- Fibonacci extension target levels tell you where price might go next after the pullback ends
Think of it like this: retracements are the "where to buy" tool. Extensions are the "where to sell" tool.
The most commonly used extension levels are:
| Level | What It Represents | Reliability |
|---|---|---|
| 127.2% | Moderate extension, first target | High |
| 161.8% | Golden extension, primary target | Highest |
| 261.8% | Strong trend extension | Moderate |
| 423.6% | Extreme move, rare | Low |
The 161.8% level is the most watched. It's derived from the golden ratio (1.618) — the same ratio found in nature, art, and architecture. In markets, it's where algorithms and human traders both tend to take action.
How to Draw Fibonacci Extension Target Levels — Step by Step
Let's walk through a real example using EUR/USD.
Setup:
- EUR/USD is in an uptrend
- Swing low: 1.0800
- Swing high: 1.1000
- Pullback low: 1.0880
Step 1: Open your charting platform (TradingView, MT4, etc.)
Step 2: Select the Fibonacci Extension tool (not retracement)
Step 3: Click three points in order:
- First click: The swing low (1.0800)
- Second click: The swing high (1.1000)
- Third click: The pullback low (1.0880)
Step 4: The tool automatically projects extension levels above the swing high.
Here's what you'd see:
- 127.2% extension = 1.1054
- 161.8% extension = 1.1124
- 261.8% extension = 1.1314
The math behind it:
- Initial move: 1.1000 - 1.0800 = 200 pips
- 161.8% of 200 pips = 323.6 pips
- Add to pullback low: 1.0880 + 0.03236 = 1.1124
That 1.1124 is your primary Fibonacci extension target level.
Fibonacci Extensions in Uptrends vs Downtrends
The logic flips depending on direction.

| Trend | What You're Doing | Extension Levels Act As |
|---|---|---|
| Uptrend | Taking profit on long trades | Resistance (price may stall) |
| Downtrend | Taking profit on short trades | Support (price may bounce) |
Uptrend example: You go long EUR/USD at 1.0880. Your Fibonacci extension target levels at 1.1054 (127.2%) and 1.1124 (161.8%) give you two potential exit points. You could take half profit at the first level, let the rest run to the second.
Downtrend example: You short GBP/USD at 1.2700 after a pullback. Swing high was 1.2800, swing low was 1.2600, pullback high was 1.2700. Your 161.8% extension projects to 1.2538. That's where you'd take profit on the short.
The 3 Biggest Mistakes With Fibonacci Extension Target Levels
Let's be honest — extensions aren't magic. Here's what goes wrong:
Mistake #1: Using the Wrong Swing Points
Different traders draw Fibonacci from different swings. You might use the last 5 bars. Another trader uses the last 30 bars. Both get different levels.
The fix: Use the most recent, obvious swing. If you're on a 1-hour chart, use the last clear swing high and low. Don't overthink it.
Mistake #2: Expecting Price to Stop Exactly at the Level
Price doesn't stop at 1.1124 like a brick wall. It might spike to 1.1130, then reverse. Or blow through to 1.1180.
The fix: Use extensions as zones, not exact numbers. Give 5-10 pips of breathing room. Set your take profit at 1.1115 instead of 1.1124 if you want to be safe.
Mistake #3: Using Extensions Without Confirmation
A Fibonacci extension level alone is just a line. Price might hit it and keep going.
The fix: Wait for confirmation. Look for:
- A bearish candlestick pattern at the extension level (pin bar, engulfing)
- RSI showing overbought/oversold
- Divergence between price and momentum
When multiple signals align at a Fibonacci extension target level, the probability of a reaction increases significantly.
Fibonacci Extension Target Levels vs Other Profit-Taking Methods
| Method | How It Works | Best For | Weakness |
|---|---|---|---|
| Fibonacci Extensions | Projects from swing points | Trending markets | Subjective swing selection |
| Support/Resistance | Previous price levels | Range-bound markets | Doesn't project new highs/lows |
| Moving Averages | Dynamic levels | All market types | Lagging, slow to react |
| Risk:Reward Ratio | Fixed multiple of risk | Simple, mechanical | Ignores market structure |
Each method has its place. But Fibonacci extensions are unique because they project future levels where price hasn't been before. That's invaluable when trading breakouts or new highs.
Real Trade Example: EUR/USD with Fibonacci Extension Target Levels
Let's put it together with a complete trade.
Setup:
- Date: Tuesday, 10:00 AM EST
- Pair: EUR/USD
- Timeframe: 1-hour chart
- Trend: Uptrend (higher highs, higher lows)
Trade plan:
- Entry: 1.0880 (after pullback to 38.2% retracement)
- Stop loss: 1.0850 (below pullback low)
- Risk: 30 pips × 0.1 lots = $30
- Target 1: 1.1054 (127.2% extension) = 174 pips profit = $174
- Target 2: 1.1124 (161.8% extension) = 244 pips profit = $244
Scenario A: Price hits Target 1, stalls. You take 50% profit ($87), move stop to breakeven. Price then reverses to stop. Result: +$87.
Scenario B: Price blows through Target 1, hits Target 2. You take full profit. Result: +$244.
Scenario C: Price hits stop at 1.0850. Result: -$30.
The numbers speak for themselves. A 1:5.8 risk:reward ratio on Target 1. A 1:8.1 ratio on Target 2. That's the power of using Fibonacci extension target levels.
FAQ
What's the difference between Fibonacci retracement and extension?
Retracements measure pullbacks within a trend (where to enter). Extensions project where price might go beyond the previous swing (where to take profit). They're two sides of the same tool.

Which Fibonacci extension level is most reliable?
The 161.8% level is the most watched by traders and algorithms. It's derived from the golden ratio and tends to produce the strongest reactions. The 127.2% level is a good secondary target.
Can I use Fibonacci extensions on any timeframe?
Yes. They work on 1-minute charts for scalping and monthly charts for long-term investing. The same principles apply — just adjust your swing points to match the timeframe.
Do Fibonacci extensions guarantee price will stop at those levels?
No. No tool guarantees anything. Extensions highlight potential areas of interest. Always use them with other confirmation signals like candlestick patterns, RSI, or support/resistance.
Quick Recap
- Fibonacci extension target levels project where price might go after a pullback
- The 161.8% level is the most reliable profit target
- Draw extensions from swing low → swing high → pullback low (uptrend)
- Always combine with confirmation — don't rely on extensions alone
- Use zones, not exact numbers — give 5-10 pips of breathing room
Quick Win — Do This Now
Open your chart right now. Pull up EUR/USD on the 1-hour chart. Find the most recent clear uptrend. Identify the last swing low, swing high, and pullback low. Draw your Fibonacci extension tool. Write down the 127.2% and 161.8% levels.
Now look at where price is right now. Is it approaching one of those levels? If yes, watch for confirmation. If not, you now know where to look when it gets there.
Do this for 5 charts today. After 5, you'll start seeing these levels before they hit. That's when the edge becomes real.


