
Why Does Elliott Wave Theory Matter for Your Trades?
Let's be honest — most explanations of Elliott Wave Theory make it sound like ancient rocket science. You hear words like "fractals," "impulsive waves," and "Fibonacci extensions," and your brain checks out.
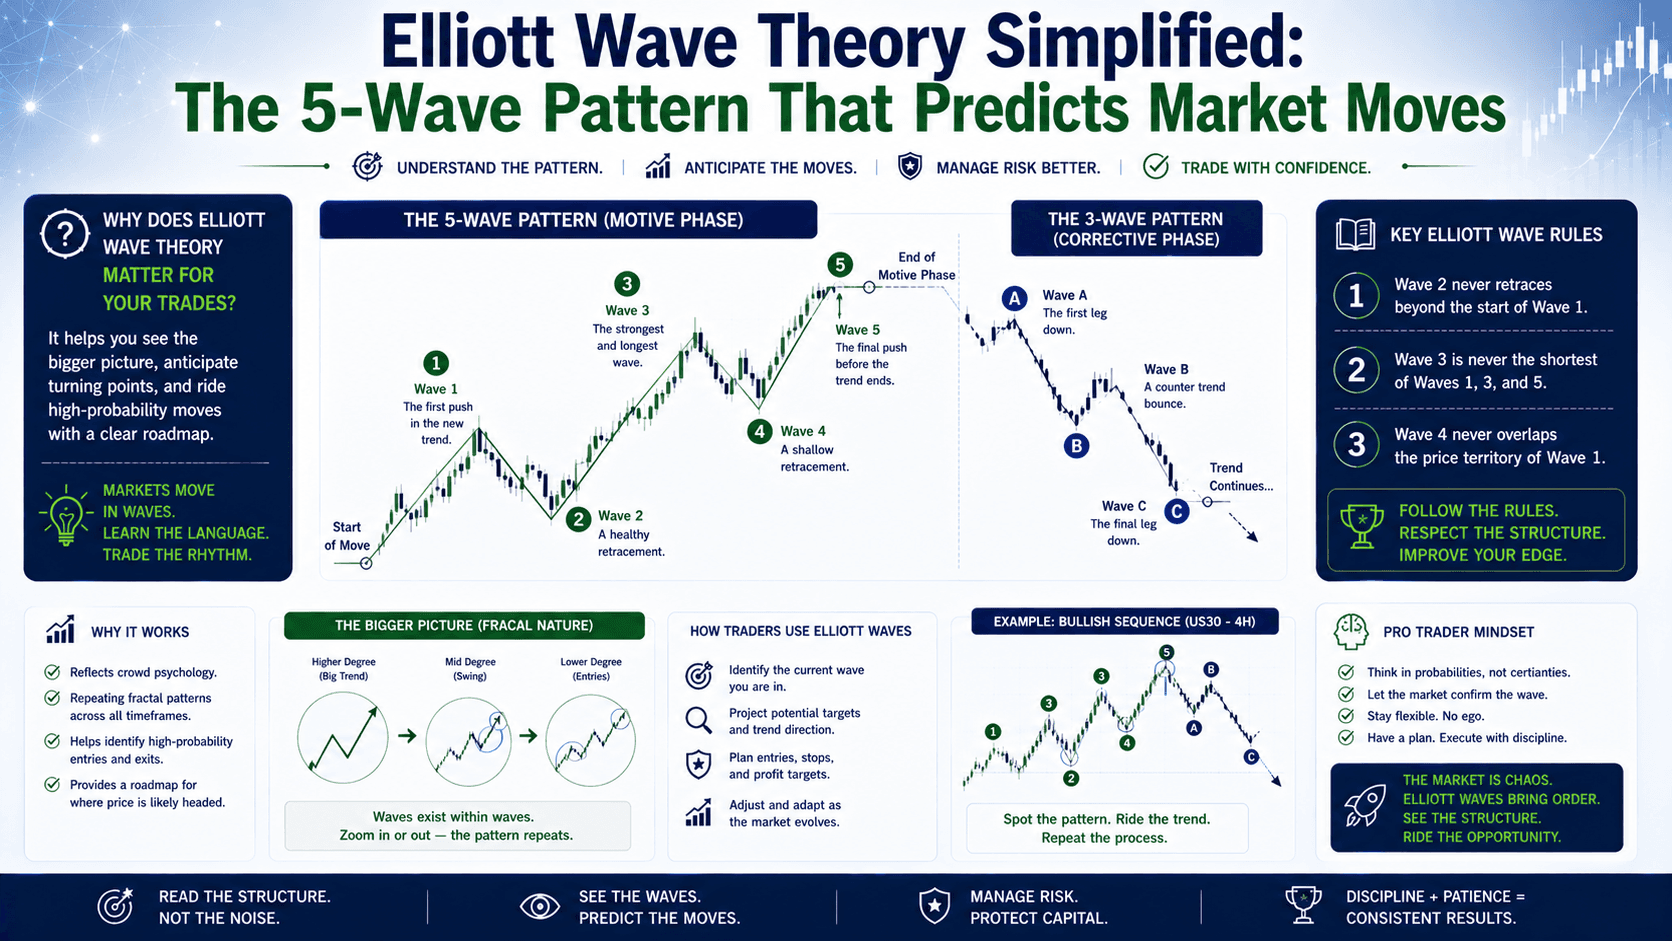
Here's the simplified version: Elliott Wave Theory is a way to read market psychology through repetitive price patterns. Developed by Ralph Nelson Elliott in the 1930s, the theory says that crowd behavior moves in predictable waves — 5 waves in the direction of the trend, then 3 waves against it.
Think of it like a heartbeat. The market doesn't move in a straight line. It surges, pauses, pulls back, and surges again. Elliott Wave helps you identify where you are in that rhythm.
And here's the kicker: most beginners get stopped out because they don't understand this rhythm. They buy at the top of a 5-wave move, right when a correction is coming. They sell at the bottom of a correction, right when the next surge is about to start.
The 5-3 Wave Structure — The Only Pattern You Need to Know
Elliott Wave breaks down into two phases:
- Motive phase (5 waves): Moves in the direction of the main trend. Labeled 1-2-3-4-5.
- Corrective phase (3 waves): Moves against the main trend. Labeled A-B-C.
Let's look at a real example. Say EUR/USD is in an uptrend.
Wave 1: EUR/USD rallies from 1.0800 to 1.0900. The move is driven by early buyers who see the trend changing.
Wave 2: Price pulls back to 1.0850 (a 50% retracement of Wave 1). Late sellers who missed the move try to get in.
Wave 3: The strongest wave. EUR/USD surges from 1.0850 to 1.1050. This is where the bulk of the profit happens. Volume is high, momentum is strong.
Wave 4: A shallow pullback to 1.1000 (a 38.2% retracement of Wave 3). The trend is still up, but the move is losing steam.
Wave 5: Final push to 1.1100. Volume is lower than Wave 3. Momentum indicators show divergence — price makes a new high, but the indicator doesn't. This is a warning sign.
Wave A: Price drops to 1.1000. The correction begins.
Wave B: A weak bounce back to 1.1050. Many traders think the trend is resuming. It's a trap.
Wave C: Price falls to 1.0900. The correction is complete.
3 Hard Rules That Keep Your Wave Count Accurate
Elliott Wave has three inviolable rules. Break these, and your count is wrong:

| Rule | What It Means | Why It Matters |
|---|---|---|
| Wave 2 cannot retrace more than 100% of Wave 1 | If the pullback goes below the start of Wave 1, your count is invalid. | This protects you from misidentifying a new trend. If price breaks below the Wave 1 low, the trend is still down. |
| Wave 3 can never be the shortest impulse wave | Wave 3 is usually the longest and strongest. If Wave 1 or Wave 5 is longer, your count is likely wrong. | Wave 3 is where the big money moves. If it's not the strongest, the trend is weak. |
| Wave 4 cannot overlap with Wave 1 | The low of Wave 4 must stay above the high of Wave 1. If it overlaps, the pattern is invalid. | Overlap signals a different pattern (like a diagonal or a corrective structure). |
Common Mistakes That Blow Up Beginner Accounts
Here's where most traders go wrong with Elliott Wave:
Mistake 1: Forcing a 5-wave count on every move
Not every trend is a clean 5-wave structure. In today's markets, 3-wave moves are more common, especially in forex. If you force a 5-wave count where there isn't one, you'll enter trades at the worst possible time.
Mistake 2: Ignoring Fibonacci
Elliott Wave and Fibonacci go together like coffee and cream. Wave 2 often retraces to the 50-61.8% level of Wave 1. Wave 3 often extends to 161.8% of Wave 1. Wave 4 retraces to the 38.2% level of Wave 3. Without Fibonacci, you're guessing where the waves end.
Mistake 3: Trading Wave 5 without confirmation
Wave 5 is the final push. It's often weak and shows divergence. Many beginners buy at the top of Wave 5 because the news is positive and everyone is bullish. That's exactly when the correction (Wave A) starts.
Elliott Wave vs Simple Support and Resistance — Which Wins?
| Factor | Elliott Wave Theory | Support & Resistance |
|---|---|---|
| Predictive power | High — tells you where in the trend you are | Medium — tells you where price might stop, but not the direction |
| Complexity | High — requires practice and multiple timeframes | Low — draw horizontal lines, easy to learn |
| Best for | Trending markets with clear waves | Ranging markets and clear levels |
| False signals | High if counts are forced | Lower — levels are more objective |
| Learning curve | Steep — 3-6 months to get consistent | Shallow — 1-2 weeks to master basics |
FAQ
Is Elliott Wave Theory accurate for forex trading?
No theory is 100% accurate. Elliott Wave gives you a framework for probability, not certainty. When combined with Fibonacci and other tools, it can help you find high-probability setups.

How long does it take to learn Elliott Wave Theory?
Most traders need 3-6 months of daily practice to get consistent. Start with higher timeframes (4-hour and daily) where waves are clearer. Don't start on 1-minute charts — you'll get confused.
Can I use Elliott Wave on any currency pair?
Yes, but it works best on pairs with clear trends and liquidity, like EUR/USD, GBP/USD, and USD/JPY. Avoid pairs with erratic movements or low volume.
What's the biggest mistake beginners make with Elliott Wave?
Forcing a wave count when the market is ranging. If you can't clearly see 5 waves, don't trade. Wait for a clean pattern.
Quick Recap
- Elliott Wave Theory predicts market moves using a 5-3 wave pattern (5 waves with the trend, 3 against it).
- Three hard rules: Wave 2 can't retrace 100% of Wave 1, Wave 3 can't be the shortest, and Wave 4 can't overlap Wave 1.
- Combine Elliott Wave with Fibonacci retracements and extensions for better accuracy.
- Don't force a 5-wave count — 3-wave moves are common in today's markets.
- Wave 5 is often a trap. Look for divergence before entering.
Your Quick Win
Open your EUR/USD chart on the 4-hour timeframe right now. Look for a clear 5-wave move in the last 2 weeks. Label waves 1 through 5. Then check if Wave 2 retraced to the 50-61.8% level of Wave 1. If it did, you've just identified a valid Elliott Wave pattern. Do this for 5 different pairs — you'll start seeing the rhythm.


