
Why Most Traders Miss These Reversal Signals — And How You Won't
You're watching EUR/USD climb. It hits 1.0950, pulls back to 1.0920, then rallies again to 1.0950. You think: "This thing is going to the moon." So you buy. Then it drops to 1.0890, then 1.0850. Your stop gets hit. You're down $50 on a 0.1 lot trade.
Sound familiar? You just got caught in a double top — one of the most reliable reversal patterns in forex. And you missed it because nobody taught you how to see it.
The double top and double bottom patterns are the market's way of saying: "I tried twice. I failed twice. Time to go the other way." If you can spot them, you can enter reversals early — before the crowd piles in.
What Are Double Top and Double Bottom Patterns?
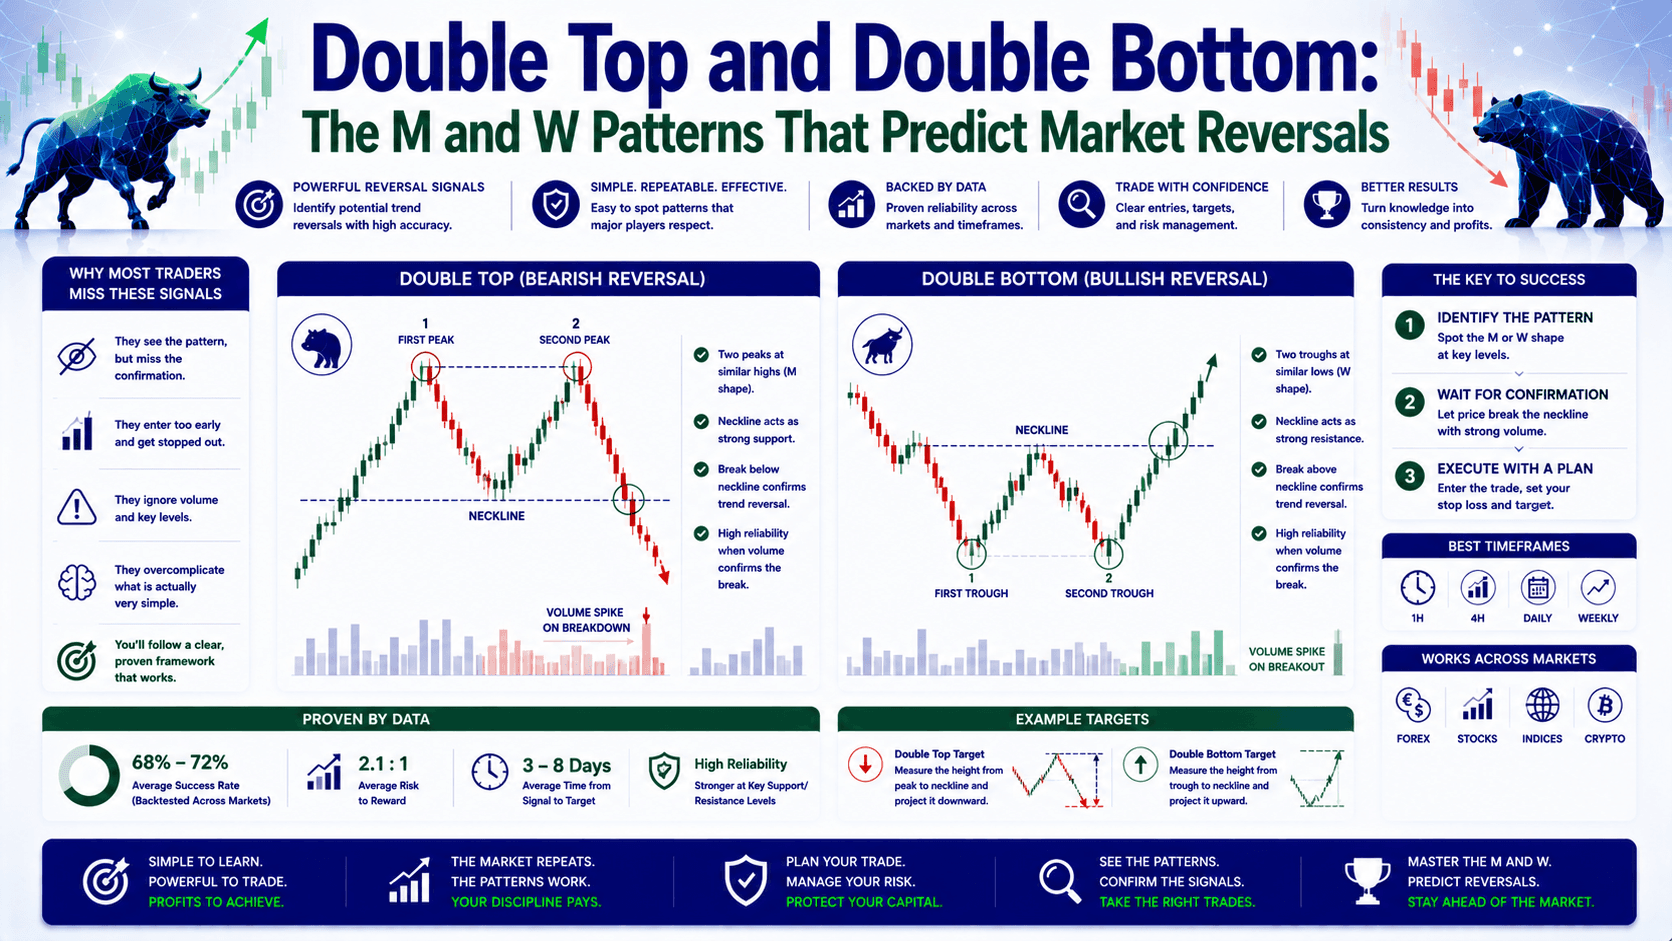
A double top looks like the letter M. It forms after an uptrend when price hits a resistance level twice, fails to break higher, then reverses downward. A double bottom looks like the letter W. It forms after a downtrend when price hits support twice, fails to break lower, then reverses upward.
Both patterns tell you the same thing: momentum is exhausted. The bulls (or bears) tried twice to push price through a key level. They couldn't. Now the other side takes control.
Double Top — The Bearish Reversal
Here's how it plays out on EUR/USD:
- First top: Price rallies from 1.0800 to 1.0950, then pulls back to 1.0900
- Second top: Price rallies again to 1.0950, but can't break above it
- Neckline: The support level at 1.0900 (the low between the two tops)
- Breakout: Price drops below 1.0900 — the pattern is confirmed
Let's run the numbers. You enter short at 1.0895 after the neckline breaks. Stop loss at 1.0960 (above the second top). Target measured from neckline to peak: 1.0950 - 1.0900 = 50 pips. So target is 1.0900 - 50 pips = 1.0850.
On 0.1 lots: risk is 65 pips × $1 = $65. Reward is 45 pips × $1 = $45. That's a 1:0.7 risk-reward — not great. The fix? Wait for a retest of the neckline before entering. That improves your entry and your R:R.
Double Bottom — The Bullish Reversal
Now let's flip it. GBP/USD is in a downtrend, dropping from 1.2700 to 1.2550. It bounces to 1.2620, then drops again to 1.2550. But it holds. That's your double bottom.
- First bottom: Price drops to 1.2550, bounces to 1.2620
- Second bottom: Price drops to 1.2550 again, holds
- Neckline: Resistance at 1.2620 (the peak between the two bottoms)
- Breakout: Price breaks above 1.2620 — pattern confirmed
Entry at 1.2625. Stop at 1.2530 (below the second bottom). Target: 1.2620 - 1.2550 = 70 pips. So target is 1.2620 + 70 pips = 1.2690. On 0.1 lots: risk is 95 pips × $0.68 (GBP/USD pip value) = $64. Reward is 65 pips × $0.68 = $44. Again, not ideal. Wait for the retest.
Double Top vs Double Bottom: Side-by-Side Comparison
| Feature | Double Top | Double Bottom |
|---|---|---|
| Shape | M | W |
| Trend before pattern | Uptrend | Downtrend |
| Signal | Bearish reversal | Bullish reversal |
| Neckline | Support between tops | Resistance between bottoms |
| Entry | Below neckline | Above neckline |
| Stop loss | Above second top | Below second bottom |
| Profit target | Neckline height projected down | Neckline height projected up |
The Wrong Way vs The Right Way to Trade These Patterns
The wrong way: You see two peaks on EUR/USD and immediately short at 1.0900. Price drops 5 pips, then reverses back above 1.0950. You're stopped out for a loss. That's a false breakout — and it happens all the time.

The right way: Wait for the neckline to break AND close below it. Then wait for a retest of the neckline as new resistance. Enter on the retest. Your stop is tighter, your R:R improves, and you avoid the fakeout.
Here's the data: On 0.1 lots of EUR/USD, entering at the neckline break gives you a 1:0.7 R:R. Waiting for the retest gives you a 1:1.5 or better. Same pattern, better execution.
How to Avoid False Breakouts — 3 Confirmation Filters
The biggest trap with double top and double bottom patterns is the fakeout. Price breaks the neckline, you enter, then it reverses and takes your stop. Here's how to filter those out:
1. Volume Confirmation
When the neckline breaks, volume should spike. If the breakout happens on low volume, it's likely a fake. On high volume, institutions are committing to the move.
2. Candle Close Confirmation
Don't enter on the first tick below the neckline. Wait for the candle to close below it. A 1-hour candle closing 10 pips below the neckline is a stronger signal than a 5-minute wick touching it.
3. RSI Divergence
On the double top, check if RSI made a lower high on the second peak compared to the first. That's bearish divergence — it confirms the pattern. For double bottoms, look for bullish divergence: RSI makes a higher low while price makes a lower low.
FAQ
How reliable are double top and double bottom patterns?
They are moderately reliable but not perfect. Studies suggest a 60-70% success rate when confirmed with volume and RSI divergence. False breakouts are common — always use confirmation filters.

Can I trade double tops and bottoms on any timeframe?
Yes. They work on 5-minute charts for scalping and daily charts for swing trading. Higher timeframes produce more reliable signals. A double bottom on the daily chart is stronger than one on the 15-minute chart.
What's the difference between a double top and a failed double top?
A failed double top happens when price breaks the neckline, then reverses and breaks above the second top. That's a bull trap. The key difference: a real double top shows exhaustion at resistance. A failed one shows buyers stepping in aggressively.
How do I set profit targets?
Measure the height of the pattern (from neckline to peak or trough) and project that distance from the neckline. For a double top: neckline - height = target. For a double bottom: neckline + height = target.
Quick Recap
- Double top = M shape after uptrend = bearish reversal
- Double bottom = W shape after downtrend = bullish reversal
- Neckline break confirms the pattern — but wait for retest for better R:R
- Use volume, candle close, and RSI divergence to filter false breakouts
- Profit target = pattern height projected from neckline
Quick Win — Do This Right Now
Open your EUR/USD chart on the 1-hour timeframe. Scroll back through the last 2 weeks. Find any M or W shape where price touched the same level twice within 50 pips. Mark the neckline. Check if the breakout held. You'll see at least 2-3 patterns — and now you know how to trade them.


