
What Is Divergence Trading with RSI and MACD?
Imagine this: EUR/USD is making higher highs on your chart. Price is climbing, everything looks bullish. But underneath, something's off. The RSI indicator is making lower highs. The MACD histogram is shrinking.
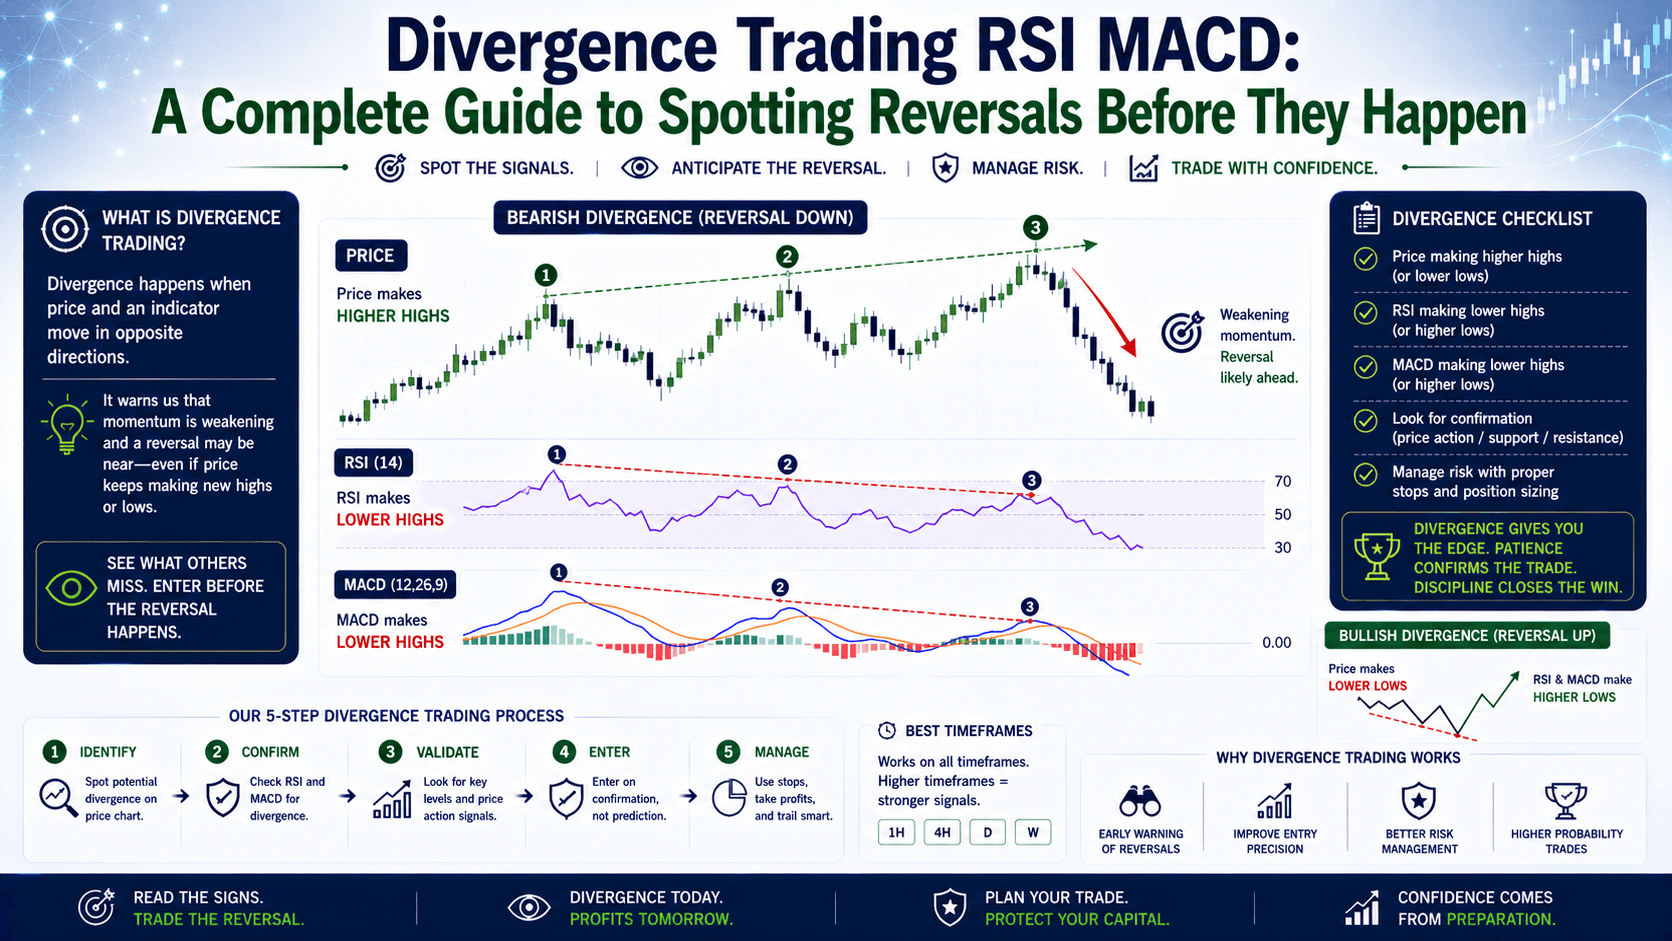
Price and momentum are telling different stories. That's divergence trading RSI MACD — one of the most reliable ways to spot trend reversals before they happen.
In simple terms, divergence happens when price and a momentum indicator move in opposite directions. It's the market's way of saying, "The trend is tired. Something's about to change."
And here's the thing: most traders miss it because they're only looking at price. They see the higher high and think the trend is strong. They don't notice the indicator quietly whispering, "This rally has no legs."
Let's break down exactly how to spot, confirm, and trade divergence using RSI and MACD.
Bullish vs Bearish Divergence — The Two Setups You Need to Know
There are two types of divergence, and they work in opposite directions. Let's compare them side by side.
| Type | Price Action | Indicator Action | What It Means |
|---|---|---|---|
| Bullish Divergence | Makes lower lows | Makes higher lows | Selling pressure is weakening. Reversal up likely. |
| Bearish Divergence | Makes higher highs | Makes lower highs | Buying pressure is fading. Reversal down likely. |
Here's a concrete example using EUR/USD.
Let's say EUR/USD is at 1.0850, then drops to 1.0820 (lower low). But the RSI at the 1.0820 low is at 32, while at the previous low of 1.0830, the RSI was at 28. That's a higher low on the indicator despite the lower low on price.
That's bullish divergence. The data suggests sellers are exhausted. If you're trading 0.1 lots, the potential move from 1.0820 back to 1.0880 is 60 pips = $60. Not bad for a signal most traders overlook.
Bearish divergence is the mirror image. Price makes a higher high, but the indicator makes a lower high. Buyers are running out of steam.
RSI Divergence vs MACD Divergence — Which One Wins?
Both RSI and MACD can show divergence, but they behave differently. Here's how they stack up:

| Factor | RSI Divergence | MACD Divergence |
|---|---|---|
| Speed | Faster — reacts to price changes more quickly | Slower — based on moving averages, more lag |
| Best Market | Range-bound or volatile markets | Trending markets |
| Signal Clarity | Single line — easy to spot peaks/troughs | Multiple lines — can be confusing |
| False Signals | More frequent in choppy markets | Fewer false signals, but delayed |
| Thresholds | Overbought (70+) / Oversold (30-) | Crossovers of MACD and signal line |
Which one should you use? The data suggests it depends on your market conditions.
In a ranging market like EUR/USD between 1.0800 and 1.0900, RSI divergence gives you faster entries. You catch the bounces earlier.
In a strong trending market like GBP/USD moving from 1.2600 to 1.2800, MACD divergence is more reliable. It filters out the noise and only signals when the trend is genuinely weakening.
But here's the truth: you don't have to choose. The best approach is to use both.
The 9 Rules You Must Follow for Divergence Trading
Divergence trading is powerful, but it's also easy to get wrong. Most beginners see what they want to see. They force the pattern onto every chart.
Here are the rules that separate profitable divergence traders from the rest:
Rule 1: Start with Price, Not the Indicator
Look for a clear higher high or lower low on price first. If you don't see one, there's no divergence to trade. Don't stare at the oscillator and try to find a matching price pattern — that's backwards.
Rule 2: Connect Successive Tops or Bottoms Only
Draw a line from one swing high to the next swing high. Don't skip over a swing in between. The comparison must be between adjacent momentum readings.
Rule 3: Keep It Vertical
The indicator peak must line up vertically with the price peak. If the timing doesn't match, the divergence isn't valid. Drop a straight line down — it should land right on the indicator's corresponding high or low.
Rule 4: Check the Slopes
Divergence only exists when the slope of the indicator line differs from the slope of the price line. If both are sloping up, there's no divergence — just confirmation that the trend is intact.
Rule 5: Don't Chase Played-Out Setups
If price has already reversed and moved significantly, the divergence is played out. You missed the boat. Wait for the next swing high or low to form. FOMO will destroy your risk-to-reward ratio.
Rule 6: Use Longer Timeframes
Divergence signals on 1-hour charts or longer are more reliable. On 5-minute charts, a single large order can create a false signal. Start with 4-hour or daily charts to train your eye.
The Wrong Way vs The Right Way
Let me show you what most beginners do wrong.
The Wrong Way: Trader sees EUR/USD at 1.0850 with RSI at 72 (overbought). Price makes a higher high to 1.0860, RSI drops to 68. They immediately short, thinking it's bearish divergence. But the MACD is still climbing, and price hasn't actually formed a clear higher high — it's just a wick. Price continues to 1.0900. Stop loss hit. Loss: $50 on 0.1 lots.
The Right Way: Trader waits for EUR/USD to form a clear higher high at 1.0860 with a close above 1.0850. RSI makes a lower high at 68 vs the previous 72. MACD histogram confirms with a lower peak. They wait for price to break below the recent swing low at 1.0830 as confirmation. Then they short at 1.0828 with a stop at 1.0870 (42 pips risk = $42 on 0.1 lots). Target: 1.0770 (58 pips = $58). Risk:reward = 1:1.4.
The difference? Patience and confirmation. The right way waits for the setup to fully form and for price to confirm the reversal.
How to Combine RSI and MACD for a Stronger Signal
Using a single indicator for divergence is okay. Using both is better. Here's a simple framework:
- Step 1: Identify a potential swing high or low on price.
- Step 2: Check RSI for divergence. Is the RSI making a higher low (bullish) or lower high (bearish)?
- Step 3: Check MACD for confirmation. Is the MACD histogram also showing divergence? Is the MACD line crossing the signal line?
- Step 4: Wait for price to break the nearest swing point (support for a short, resistance for a long).
- Step 5: Enter only after confirmation. Place stop loss beyond the recent swing high/low.
Let's apply this to a real scenario with Gold (XAU/USD).
Gold is at $2,350, making a higher high at $2,365. RSI makes a lower high at 74, down from 78. MACD histogram shows a lower peak. Price then breaks below the recent swing low at $2,340. You short at $2,339 with a stop at $2,370 (31 pips risk = $310 on 0.1 lots on Gold, since 1 pip = $10). Target: $2,300 (39 pips = $390). Risk:reward = 1:1.26.
That's a trade with confluence — three signals pointing in the same direction.
FAQ
Is divergence trading RSI MACD reliable for beginners?
Yes, but only if you follow the rules strictly. Beginners often force divergence onto charts where it doesn't exist. Start with longer timeframes (4-hour or daily) to reduce false signals.

Which is better for divergence — RSI or MACD?
It depends on market conditions. RSI is faster and works better in range-bound markets. MACD is slower but more reliable in trending markets. Using both gives you the strongest signal.
How much can I make from one divergence trade?
With a $1,000 account risking 2% per trade ($20), a divergence trade with a 1:2 risk-to-reward ratio could return $40. On 0.1 lots of EUR/USD with a 50-pip target, that's $50. Results vary based on market conditions and your strategy.
Can divergence fail?
Yes. Divergence is not a guarantee — it's a probability. False signals happen, especially in choppy markets. Always use stop losses and wait for price confirmation before entering.
Quick Recap
- Divergence happens when price and indicator move in opposite directions — a warning of weakening momentum.
- Bullish divergence: price makes lower lows, indicator makes higher lows = potential reversal up.
- Bearish divergence: price makes higher highs, indicator makes lower highs = potential reversal down.
- RSI is faster for range-bound markets; MACD is more reliable in trends.
- Combine both indicators for stronger signals, and always wait for price confirmation.
- Use longer timeframes (1-hour+) for more reliable divergence signals.
Quick Win
Open your chart right now. Pull up EUR/USD on the 4-hour timeframe. Scroll back to the last 20 candles. Find one clear higher high and one clear lower low. Now check the RSI below the chart. Does the RSI show a higher low at the same time price made a lower low? That's a potential bullish divergence waiting to happen. Mark it on your chart and watch what price does next.


