
Why Most Beginners Fail at Day Trading (And How to Avoid It)
Let me guess. You've read about day trading. You've seen the screenshots of people making $500 in an hour. You opened a demo account, placed a few trades, and... either got stopped out immediately or watched price move sideways for four hours before you closed in frustration.
Sound familiar?
Here's the truth nobody tells you: 90% of beginner day traders lose money in their first year. Not because they're dumb. Not because the market is rigged. But because they jump in without a real strategy.
They chase breakouts that fake out. They buy at resistance and sell at support. They set stop losses at round numbers and get picked off by algorithms.
I've been there. I blew my first account — $2,500 — in three months doing exactly this.
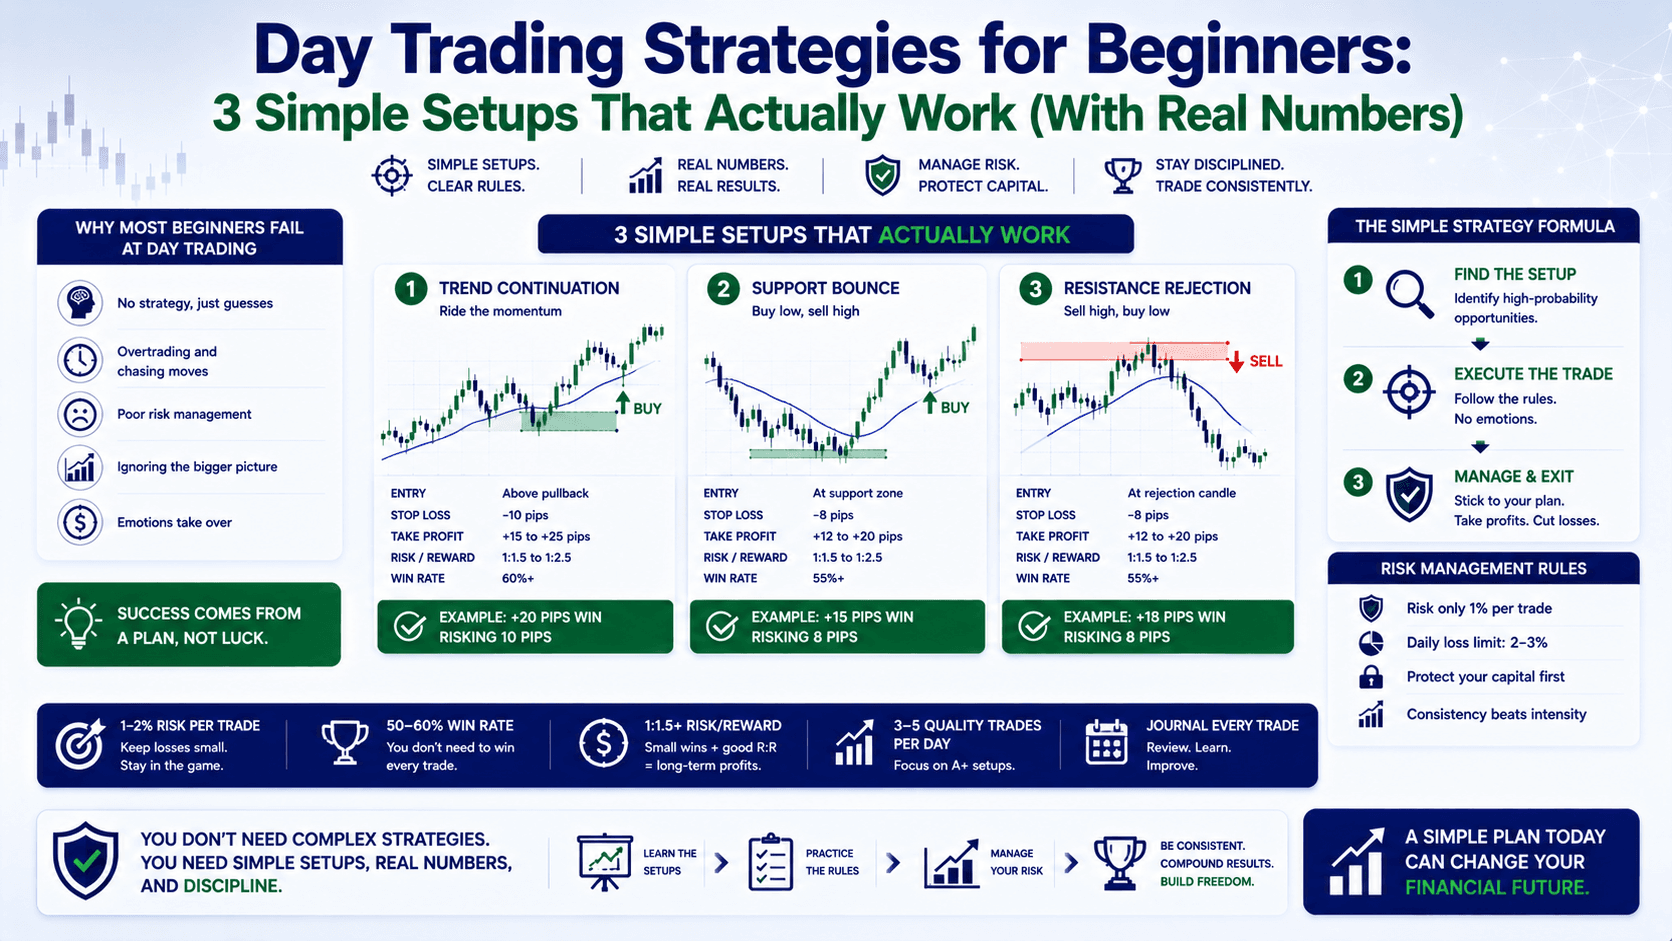
But here's the good news: day trading strategies for beginners don't need to be complicated. You don't need 15 indicators. You don't need a Bloomberg terminal. You need 3 simple setups, a clear plan, and the discipline to follow it.
In this lesson, I'm going to show you exactly those 3 setups. With real numbers. With real entry and exit rules. With the mistakes to avoid at every step.
What Is Day Trading? (And Why It's Different From Gambling)
Day trading means opening and closing a trade within the same trading day. You don't hold positions overnight. No swaps. No worrying about gap risk when the market opens Monday morning.
The goal is simple: capture a small piece of the daily move — 20, 30, maybe 50 pips — and walk away.
Here's the key difference between day trading and gambling:
Gambling = random bets with no edge.
Day trading = repeating a proven setup with controlled risk, knowing that some trades will lose, but over 100 trades, you come out ahead.
Let's put numbers on this.
Say you have a $1,000 account. You risk 2% per trade = $20 max loss. You use a setup that wins 60% of the time, with a 1:2 risk-to-reward ratio.
On 10 trades:
- 6 winners: +$40 each (2R) = +$240
- 4 losers: -$20 each = -$80
- Net profit: +$160
That's 16% return on a $1,000 account in 10 trades. That's the math of day trading done right.
Setup #1: The Pullback Trend Trade (The Easiest One)
Most beginners try to catch tops and bottoms. They see a big green candle and think "it's going higher" — so they buy at the top. Then price reverses and they're underwater in 10 minutes.

The smarter move: wait for a pullback within an established trend.
Here's how it works:
Step 1: Identify the trend on the H1 chart.
Look at the last 20 candles. Are they making higher highs and higher lows? That's an uptrend. Lower highs and lower lows? Downtrend.
Step 2: Wait for a pullback.
In an uptrend, price will occasionally dip back toward a moving average or a support level. That's your entry opportunity.
Step 3: Enter on the first sign of rejection.
Look for a candle with a long lower wick (a rejection candle) at the pullback level. That tells you buyers are stepping back in.
Real example using EUR/USD:
EUR/USD is in an uptrend on H1. Price pulls back from 1.0870 to 1.0845 — a 25-pip dip. You see a hammer candle at 1.0845 with a long lower wick. The next candle opens higher.
- Entry: 1.0847 (just above the hammer's close)
- Stop loss: 1.0830 (below the pullback low)
- Target: 1.0880 (previous high)
- Risk: 17 pips
- Reward: 33 pips
- Risk:Reward: ~1:2
On 0.1 lots, that's $17 risk to make $33. On 0.05 lots, it's $8.50 risk to make $16.50. Adjust based on your account size.
Pullback Trend Trade: Wrong vs. Right
| Wrong Way | Right Way |
|---|---|
| Buy at the top of the move (chasing) | Wait for a pullback to support |
| Set stop loss too tight (gets taken out by noise) | Give 5-10 pips breathing room below support |
| No target — hold and hope | Set a clear target at the previous high |
| Risk 5%+ of account | Risk 1-2% max |
Setup #2: The Range Breakout (Catching the Explosion)
Markets don't trend all day. Sometimes they sit in a tight range — bouncing between support and resistance — like a coiled spring. Eventually, price breaks out.
Your job: catch the breakout early.
Step 1: Identify a range on the M15 or M30 chart.
A range has at least 3 touches at the top (resistance) and 3 touches at the bottom (support). The range width should be at least 20 pips (too tight and you get fakeouts).
Step 2: Wait for a clean breakout.
Don't enter on the first candle that breaks the range. Wait for a candle to close outside the range. That confirms the breakout is real.
Step 3: Enter on the retest.
After the breakout, price often pulls back to retest the broken level (resistance becomes support). That's your entry.
Real example using GBP/USD:
GBP/USD has been ranging between 1.2650 (support) and 1.2690 (resistance) for 3 hours. Price breaks above 1.2690 and closes at 1.2698. Then it pulls back to 1.2688 (retesting the breakout level).
- Entry: 1.2690 (on the retest)
- Stop loss: 1.2660 (below the range)
- Target: 1.2740 (projected range width: 40 pips above breakout)
- Risk: 30 pips
- Reward: 50 pips
- Risk:Reward: ~1:1.7
Common trap: Fake breakouts happen all the time. Price breaks above resistance, then immediately reverses back into the range. That's why you wait for a close outside the range AND a retest. Patience saves you.
Setup #3: The News Reversal (For Volatility Lovers)
Economic news releases — like Non-Farm Payrolls or FOMC rate decisions — cause massive volatility. Price can move 50-100 pips in minutes.
Most beginners try to predict the news direction. They buy before the announcement and get crushed when the opposite happens.
The smarter play: wait for the initial spike, then trade the reversal.
Step 1: Identify a high-impact news event.
Check the economic calendar. Look for events marked "red" or "high impact."
Step 2: Wait 5-10 minutes after the release.
Let the initial spike happen. Don't chase it. The first move is often overdone — algorithms overreact, then price corrects.
Step 3: Look for a rejection candle at a key level.
If price spikes up but forms a bearish engulfing candle at a resistance level, that's a reversal signal.
Real example using XAU/USD (Gold):
Non-Farm Payrolls comes in much weaker than expected. Gold spikes from $2,350 to $2,370 in 3 minutes. But at $2,370, it hits a resistance level from the previous week. A bearish engulfing candle forms.
- Entry: $2,365 (after the engulfing candle closes)
- Stop loss: $2,375 (above the spike high)
- Target: $2,345 (back to the pre-news level)
- Risk: $10 (100 points on Gold = ~$10 on 0.1 lots)
- Reward: $20 (200 points)
- Risk:Reward: 1:2
⚠️ Warning: News trading is high risk. Spreads widen dramatically during news events. Use a wider stop loss than usual. And only risk 1% of your account max on these trades.
Day Trading Strategies for Beginners: Comparison Table
| Setup | Best For | Timeframe | Avg. Hold Time | Risk Level |
|---|---|---|---|---|
| Pullback Trend Trade | Beginners | H1 | 2-4 hours | Low |
| Range Breakout | Intermediate | M15 / M30 | 1-3 hours | Medium |
| News Reversal | Experienced | M5 / M15 | 10-30 minutes | High |
FAQ
How much money do I need to start day trading forex?
You can start with as little as $100 on a micro account. With 0.01 lots, each pip on EUR/USD is worth $0.10. A 20-pip stop loss = $2 risk. Start small, prove your strategy works, then scale up.

What is the best time of day for day trading?
The best time is during the London-New York overlap (1 PM to 5 PM GMT). That's when volatility and volume are highest. Avoid the Asian session (low volatility) and the first 30 minutes after major news (too unpredictable).
Can I make a living day trading with a small account?
It's extremely difficult with less than $5,000. With a $1,000 account, risking 2% per trade, your max loss is $20. To make a living, you'd need to hit 10+ winning trades every day. Focus on building your account slowly first.
How many trades should I take per day?
Quality over quantity. Most professional day traders take 1-3 trades per day. Taking 10+ trades is a sign of overtrading — and that's how you lose money. Wait for your setup, take it, and step away.
📝 Quick Recap
- Day trading = open and close within the same day. No overnight risk.
- Setup #1: Pullback trend trade — wait for a dip in a trend, buy the rejection.
- Setup #2: Range breakout — wait for a close outside the range, enter on retest.
- Setup #3: News reversal — wait for the spike, trade the correction.
- Always: Risk 1-2% per trade. Use a stop loss. Know your target before you enter.
Your Quick Win (Do This Today)
Open your MT4 or TradingView chart. Pull up EUR/USD on the H1 timeframe. Scroll back through the last 5 trading days. Find 3 pullback trend trades that would have worked. Write down the entry, stop loss, and target for each. Practice identifying the setup — even without real money — until it becomes second nature.


