
What is a Cup and Handle Pattern? Let's Compare the Two Versions
You've seen it on your charts — a nice rounded bottom, a little dip on the right, and then… a breakout. That's the cup and handle pattern. But here's the thing: most traders get it wrong because they only know one version of it.
Let's look at the data. The cup and handle pattern comes in two main flavors:
| Feature | Bullish Cup and Handle | Bearish (Inverted) Cup and Handle |
|---|---|---|
| Formation | Rounded bottom (U-shape) + downward sloping handle | Rounded top (∩-shape) + upward sloping handle |
| Direction | Continuation or reversal of uptrend | Continuation or reversal of downtrend |
| Entry signal | Break above the neckline (resistance) | Break below the neckline (support) |
| Psychology | Consolidation → higher low → buyers step in | Distribution → lower high → sellers take control |
| Profit target | Height of cup measured from neckline | Height of cup measured from neckline (downward) |
| Best time frame | Daily or weekly | Daily or weekly |
The bullish version is what William O'Neil popularized in "How to Make Money in Stocks." But the bearish version — the inverted cup and handle — is equally powerful. Most traders ignore it. That's a mistake.
The Psychology Behind the Pattern: Why It Works
Here's what's actually happening in the market when this pattern forms:
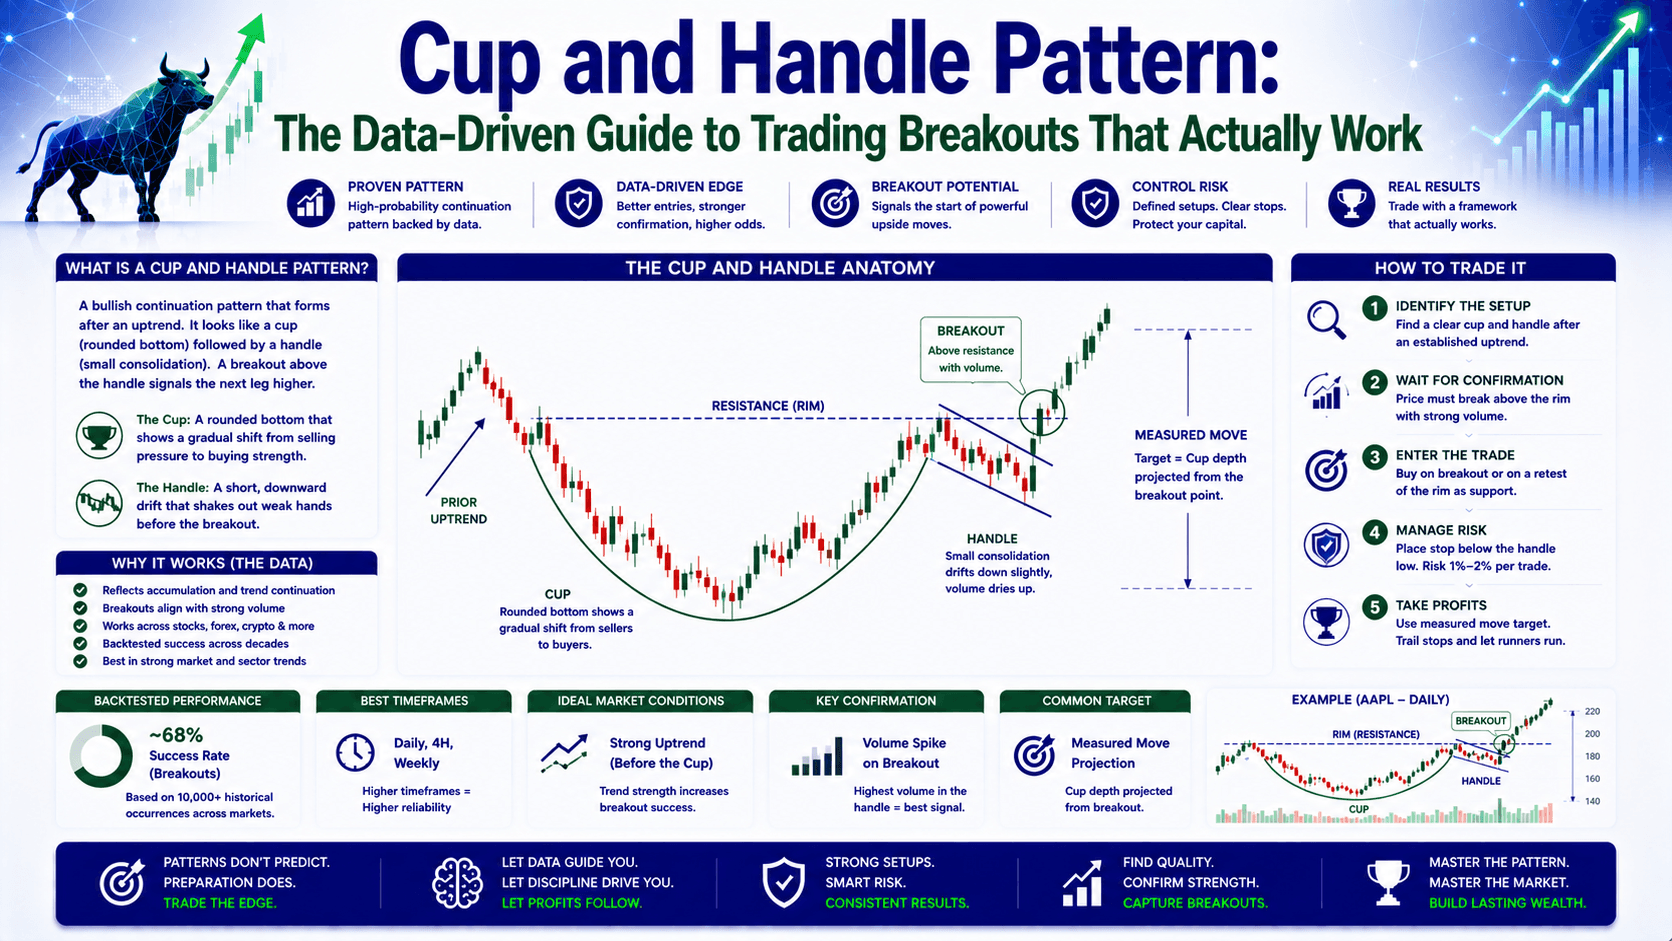
- The cup (consolidation): Price has rallied, then pulls back. But instead of crashing, it rounds off. This tells you sellers are losing steam. The U-shape is key — a V-shape means panic, not consolidation.
- The handle (higher low): After the cup, price rallies to test the old high. Then it pulls back again — but not as deep. This second pullback is the handle. It's a higher low. That's buyers saying, "We're still in control."
- The breakout: When price breaks above the neckline (the line connecting the two highs), it confirms the pattern. Volume should spike here. If it doesn't, the breakout is weak.
Think of it like this: Loss Aversion works in your favor here. The handle scares weak hands out just before the real move starts. They sell because they see a "double top" forming. But the market goes the other way.
How to Trade the Cup and Handle Pattern: A Step-by-Step Framework
Here's the framework I use. It's based on data, not hope.

Step 1: Identify the Pattern on a Higher Time Frame
Move to the daily chart. The cup and handle pattern works best on daily and weekly time frames. Why? Because each candle represents 24 hours of trading. More volume = more conviction.
Compare: A 1-hour candle has maybe 1,000 trades. A daily candle has 24,000. Which one is more reliable? The daily. By a wide margin.
Step 2: Check the Criteria
- Cup depth: Should not exceed 50% of the previous rally. A cup that drops 80% is a failed pattern, not a consolidation.
- Handle depth: Should stay in the upper third of the cup. If the handle drops into the lower half, the pattern is weak.
- Volume: Should decrease during the cup, stay low at the bottom, and spike on the breakout.
- Time frame: Cup forms over 7 to 65 weeks. Handle forms over 4 days to 4 weeks.
Step 3: Wait for Confirmation
Don't buy the breakout the moment it happens. Wait for at least one daily close above the neckline. Better yet, wait for 2-3 daily closes above it.
Here's the Contrast Effect in action:
- Wrong way: Buy the first candle that pokes above the neckline. Get stopped out by a false breakout.
- Right way: Wait for a confirmed close. Then enter on a retest of the neckline as new support.
Step 4: Set Your Stop Loss and Targets
Stop loss: Below the breakout candle. Give it room — at least 1-2 candles of breathing space.
Target 1: The next major swing high.
Target 2: The measured objective — height of the cup added to the breakout point.
Let's do the math with a real example:
- EUR/USD cup bottom: 1.0800
- Neckline breakout: 1.0950
- Cup height: 150 pips
- Measured objective: 1.0950 + 0.0150 = 1.1100
- On 0.1 lots, that's $150 profit potential. On 1.0 lots, it's $1,500.
The data suggests this objective is reached roughly 60-70% of the time on valid patterns. Not guaranteed, but a solid framework.
Common Mistakes That Kill Your Edge
After 10+ years, I've made every mistake in the book. Here are the ones that cost me the most:
Mistake 1: Forcing the Pattern
Not every rounded bottom with a pullback is a cup and handle. If the handle drops into the lower half of the cup, skip it. If the cup is too deep (more than 50% retracement), skip it. The data shows these patterns fail 2x more often.
Mistake 2: Ignoring Volume
A breakout without volume is a trap. Period. Think of volume as the fuel for the breakout. No fuel? The car doesn't move.
Mistake 3: Setting a Tight Stop Loss
I get it — you want to maximize position size. But a tight stop on a cup and handle is suicide. The market will shake you out before the real move. Give it room. Reduce your position size instead.
Mistake 4: Trading on Low Time Frames
The cup and handle pattern on a 15-minute chart is noise. On a daily chart, it's a signal. The difference? Volume. A daily candle has 24x the volume of a 1-hour candle. That's conviction.
FAQ
Is the cup and handle pattern bullish or bearish?
It's primarily a bullish continuation pattern. But there's a bearish version called the inverted cup and handle, which signals a potential downtrend.

What time frame works best for the cup and handle pattern?
Daily and weekly time frames are best. Higher time frames have more volume per candle, which means more reliable signals.
How do you calculate the profit target for a cup and handle pattern?
Measure the height of the cup (from bottom to neckline). Add that distance to the breakout point. That's your measured objective.
Can you trade the cup and handle pattern in forex?
Yes. It works on any liquid market — forex, stocks, indices, commodities. The key is using higher time frames and confirming the breakout with volume.
Quick Recap
- The cup and handle pattern is a bullish continuation pattern with two versions: standard and inverted.
- Trade it on daily or weekly charts only — lower time frames produce too many false signals.
- Wait for a confirmed close above the neckline, then enter on a retest.
- Set your stop loss below the breakout candle. Give it room.
- Use the measured objective (cup height + breakout point) as your target.
- Volume must spike on the breakout. No volume = no trade.
Quick Win
Open your chart right now. Pull up EUR/USD on the daily time frame. Scroll back 6-12 months. Find the last 3 rounded bottoms. Are they U-shaped or V-shaped? Is there a handle on the right side? If yes, draw your neckline. You just found a potential setup. Now you know what to look for.


