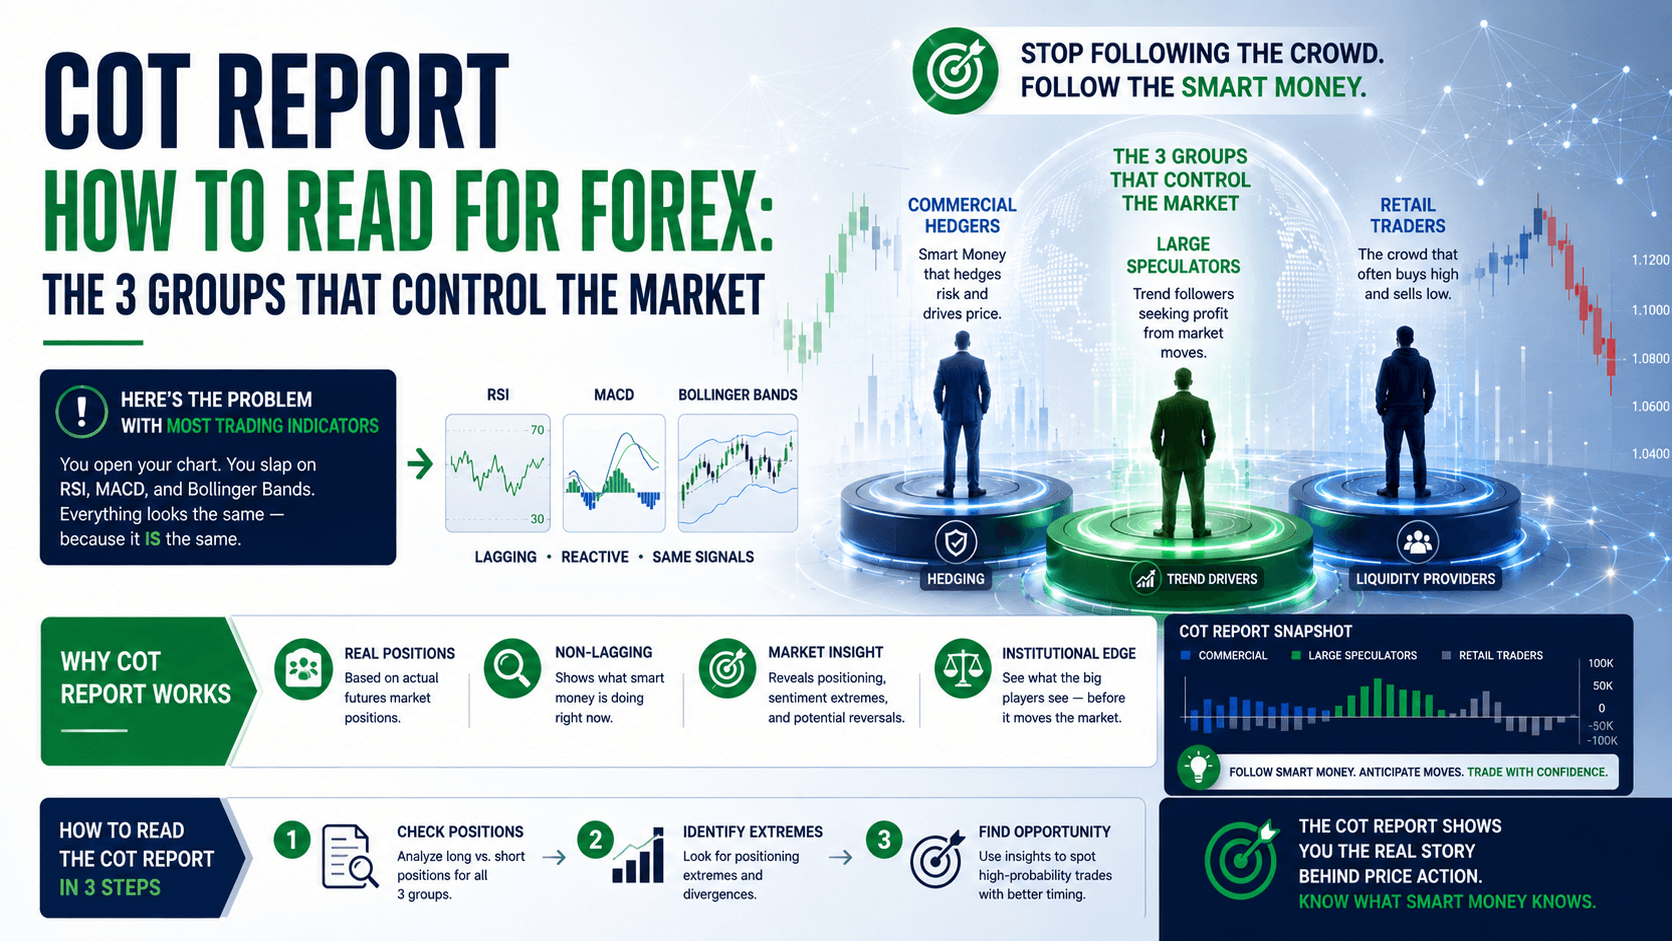

Here's the Problem with Most Trading Indicators
You open your chart. You slap on RSI, MACD, and Bollinger Bands. Everything looks the same — because it IS the same. All three are derived from price. They're not telling you anything new. They're just repeating the same data in different colors.
Now imagine an indicator that doesn't use price at all. It shows you exactly what the biggest players in the world are doing with their money. Not what they're SAYING — what they're actually DOING. That's the Commitment of Traders (COT) report.
The COT report is published every Friday by the CFTC. It shows the net long or short positions of three groups: commercials, large speculators, and small speculators. And when you know how to read it, you can see market turning points before they happen.
Let's break down exactly how to read the COT report for forex — and how to use it without getting confused.
Who Are the 3 Groups in the COT Report?
The COT report splits traders into three categories. Each one has a different motive and a different track record. Understanding who they are is the first step.
1. Commercials (The Smart Money)
These are businesses that actually use the commodity or currency. Think airlines hedging fuel costs, exporters locking in exchange rates, or farmers protecting crop prices. They're not speculating — they're protecting their business.
Because they have insider knowledge of the physical market, commercials are usually right. When they're heavily long, it's a bullish signal. When they're heavily short, it's bearish. The data backs this up — commercials have been right at major turning points more often than not.
2. Large Speculators (The Trend Followers)
Hedge funds, institutional traders, and big money managers. They trade to make a profit, and they tend to follow the trend. When the market is rallying, they buy. When it's falling, they sell.
Large speculators are generally right during the trend. But at extreme levels — when they're all crowded on one side — the trend often reverses. That's where the COT report becomes gold.
3. Small Speculators (The Retail Crowd)
That's most individual traders. Small speculators are usually wrong at major turning points. They buy at the top and sell at the bottom. The COT report shows you exactly when retail is getting crowded — and that's a contrarian signal.
How to Read the COT Report for Forex: A Simple Framework
Here's the framework I use. It's not complicated — it's just three steps.

Step 1: Check the Net Position of Commercials
Commercials are the smart money. If they're heavily net long, the market is likely undervalued. If they're heavily net short, it's likely overvalued. The key word here is "heavily" — you're looking for extremes, not small changes.
Example: In early 2023, commercials were net short EUR/USD at extreme levels. The euro was rallying. But commercial hedgers were selling into the strength. Six weeks later, EUR/USD dropped 500 pips. The smart money was right again.
Step 2: Compare Commercials vs. Small Speculators
This is where the real insight lives. When commercials and small speculators are on opposite sides of the trade — and the gap is wide — a reversal is likely. The retail crowd is usually wrong at extremes.
Let's say commercials are net long 50,000 contracts on GBP/USD, and small speculators are net short 30,000 contracts. That's a massive divergence. The smart money is buying while retail is selling. History says the smart money wins.
Here's a comparison table to make it crystal clear:
| Group | Typical Behavior | Track Record at Extremes | What to Watch For |
|---|---|---|---|
| Commercials | Hedge against price risk | Often right at turning points | Extreme net long or short |
| Large Speculators | Follow the trend | Right during trends, wrong at extremes | Crowded positioning (over 80% long or short) |
| Small Speculators | Buy high, sell low | Usually wrong at major reversals | Opposite of commercials |
Step 3: Look for Divergence Between Price and COT Data
This is the most powerful signal. Price is making higher highs, but commercials are reducing their long positions. That's a divergence. The smart money is selling into strength. The trend is likely to reverse.
Real example: In 2022, the US Dollar Index was rallying hard. But commercials were increasing their short positions. The divergence was clear. Three months later, the dollar peaked and dropped over 10%. The COT report caught it before the charts did.
The Wrong Way vs. The Right Way to Use COT
The wrong way: "The COT report shows commercials are long. I'll buy right now."
That's dangerous. The COT report is delayed by 3 days. You don't know what happened since Tuesday. Buying blindly based on old data is a recipe for getting stopped out.
The right way: Use the COT report as a filter, not a trigger. If commercials are extremely long on EUR/USD, you wait for price to show a bullish reversal pattern on the daily chart. Then you enter. The COT report tells you the direction of the smart money. Price action tells you when to pull the trigger.
The Biggest Trap Beginners Fall Into
Every forex site tells you the COT report is "smart money" data. What they don't tell you: the report is delayed by 3 days. The market moves fast. By the time you see the data, the smart money might have already reversed their positions.
The fix? Don't trade the COT report on its own. Combine it with price action. If commercials are heavily long and price is at a key support level with a bullish reversal candle — that's a high-probability setup. If commercials are long but price is still falling, wait. Let the market confirm.
FAQ
Where can I find the COT report for forex?
The official COT report is on the CFTC website. For a more visual version, use Barchart.com or Cotbase.com. Both show net positions with charts.

How often is the COT report released?
Every Friday at 3:30 PM EST. The data covers positions as of Tuesday of the same week. That's a 3-day delay.
Can I trade forex with the COT report alone?
No. The COT report is a sentiment indicator, not a timing tool. Use it to confirm direction, then enter with price action signals on the daily or 4-hour chart.
Which group is most accurate in the COT report?
Commercials (hedgers) have the best track record at major market turning points. Large speculators are good during trends but often wrong at extremes.
Quick Recap
- The COT report shows positions of 3 groups: commercials (smart money), large speculators (trend followers), and small speculators (retail crowd).
- Look for extremes in commercial positioning and divergence between commercials and small speculators.
- The report is delayed by 3 days — always combine it with price action for entry timing.
- Use it as a filter, not a standalone signal.
Quick Win: Do This in 5 Minutes
Open Cotbase.com. Search for "EUR/USD" or "US Dollar Index." Look at the net position of commercials. Is it at an extreme (top or bottom 10% of the 2-year range)? If yes, check the price chart for a reversal pattern on the daily timeframe. That's your next potential trade setup.


