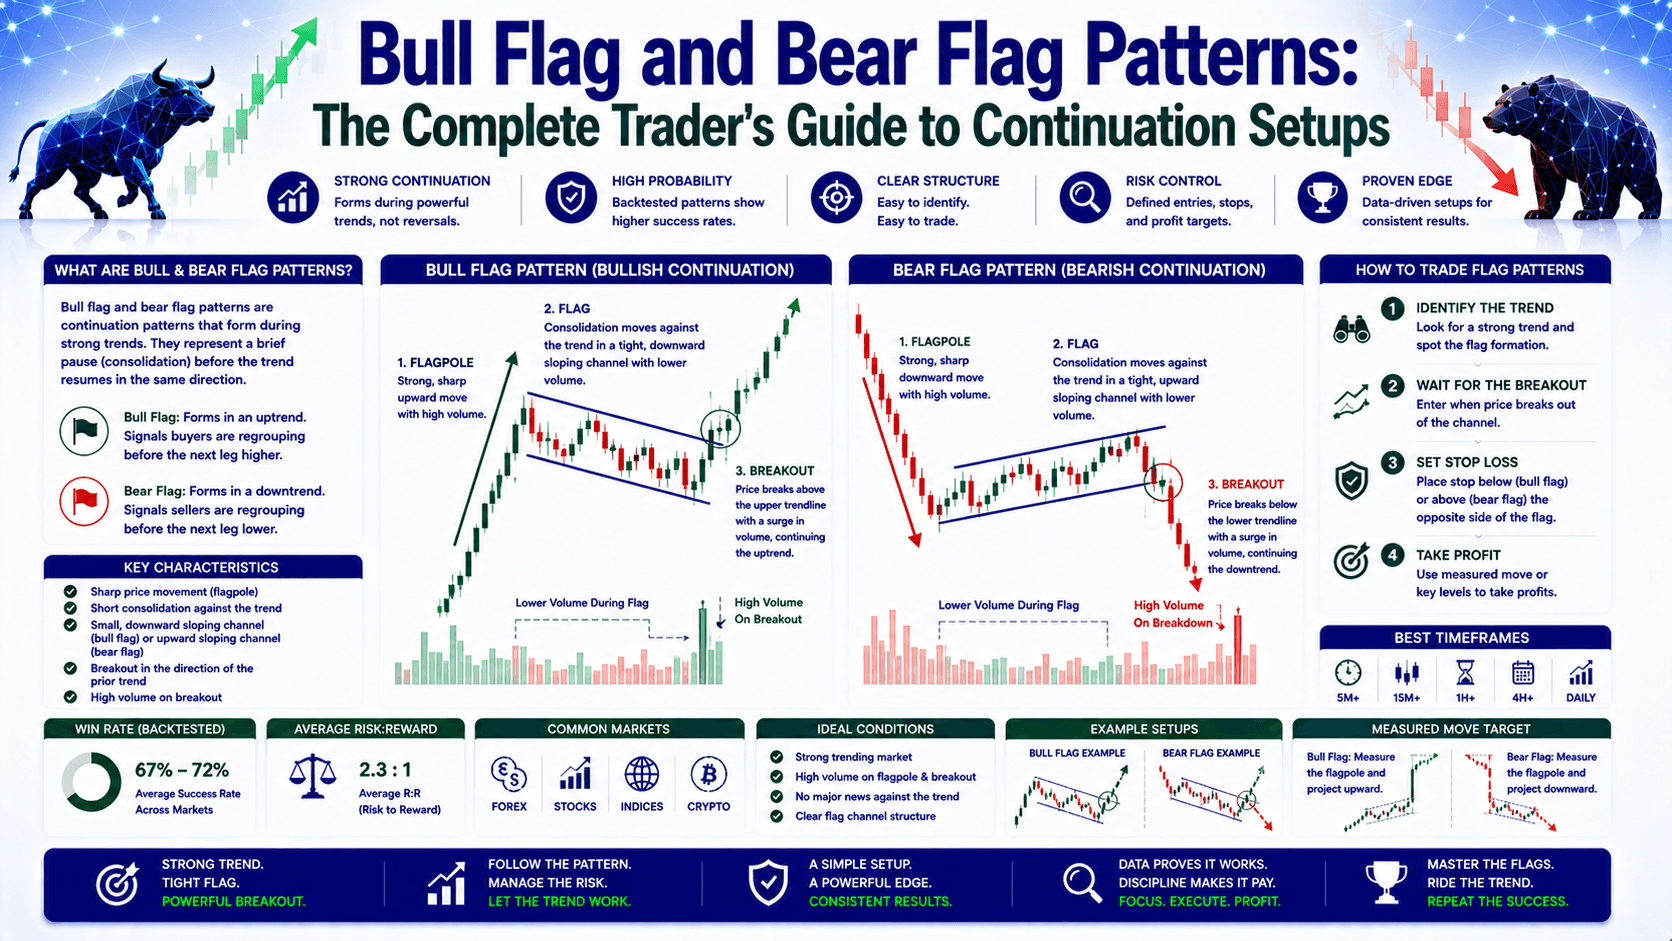

What Are Bull Flag and Bear Flag Patterns?
Let's cut through the noise. Bull flag and bear flag patterns are continuation patterns that show up during strong trends. They tell you the market is taking a breather — not reversing.
Think of it like a runner in a marathon. They sprint hard (the flagpole), then slow down to catch their breath (the flag), then sprint again (the breakout). The flag is just a pause, not the finish line.
Here's the key difference:
- Bull flag — Forms during an uptrend. Price shoots up, then drifts slightly lower in a channel. Breakout is to the upside.
- Bear flag — Forms during a downtrend. Price drops hard, then bounces slightly in a channel. Breakout is to the downside.
Both patterns work the same way. The trend is your friend — and the flag is just a short rest stop.
The Anatomy of a Flag Pattern — What You're Actually Looking At
Every flag pattern has two parts. Miss one, and you're not trading a flag — you're guessing.
The Flagpole
This is the sharp, impulsive price move. It happens fast, with strong momentum. In a bull flag, the pole goes up. In a bear flag, it goes down.
The flagpole tells you the market has energy. A steep pole = strong trend = more reliable pattern. A shallow pole? Skip it.
The Flag
After the pole, price pauses. This is the flag. It's a small channel that moves against the main trend or sideways.
For a bull flag, the flag typically slopes slightly downward. For a bear flag, it slopes slightly upward. The flag should retrace no more than 50% of the pole. If it goes deeper, the trend might be dying, not resting.
The Breakout
When price breaks out of the flag in the direction of the original trend, the pattern is confirmed. Volume should pick up at the breakout — that's the market saying "yes, this is real."
Bull Flag vs Bear Flag — Side-by-Side Comparison
| Feature | Bull Flag | Bear Flag |
|---|---|---|
| Preceding trend | Sharp upward move | Sharp downward move |
| Flag shape | Downward or horizontal channel | Upward or horizontal channel |
| Psychology | Profit-taking after rally | Short-covering after sell-off |
| Volume | High on pole, low on flag, spikes at breakout | High on pole, low on flag, spikes at breakout |
| Breakout direction | Upward | Downward |
| Trade type | Buy (long) | Sell (short) |
| Stop loss | Below the flag's low | Above the flag's high |
| Target | Pole height added to breakout | Pole height subtracted from breakout |
How to Trade Bull Flag and Bear Flag Patterns — 3 Strategies Compared
There's no single "right way" to trade these patterns. The best approach depends on your style and risk tolerance. Let's compare three common strategies.

Strategy 1: Breakout Entry (Aggressive)
You enter the moment price breaks the flag's trendline. Fast, but you risk false breakouts.
Example on EUR/USD:
EUR/USD is at 1.0850. A bull flag forms after a run from 1.0800 to 1.0880 (80-pip pole). The flag consolidates between 1.0850 and 1.0870. You enter long at 1.0875 when price breaks above the flag. Stop loss at 1.0845 (30 pips below). Target: 1.0955 (pole height of 80 pips added to breakout at 1.0875). Risk:reward = 1:2.7.
Strategy 2: Pullback Entry (Conservative)
You wait for the breakout, then let price retest the flag's upper boundary as new support. You enter on the retest. Safer, but you might miss the move.
Example on GBP/USD:
GBP/USD is at 1.2650. A bear flag forms after a drop from 1.2750 to 1.2600 (150-pip pole). Price breaks below the flag at 1.2630, then pulls back to 1.2645. You enter short at 1.2645. Stop loss at 1.2675 (30 pips above). Target: 1.2495 (150 pips below breakout). Risk:reward = 1:5.
Strategy 3: Multi-Timeframe Confirmation
You check the higher timeframe for trend direction, then look for the flag on a lower timeframe for entry. This filters out weak setups.
Example on XAU/USD (Gold):
On the daily chart, Gold is in a strong uptrend from $2,350 to $2,420. On the 1-hour chart, you spot a bull flag. The pole runs from $2,400 to $2,420 (200 points). The flag consolidates between $2,410 and $2,418. You wait for the hourly breakout above $2,418 before entering. The higher timeframe trend confirms the direction.
Comparison Table: Which Strategy Fits You?
| Strategy | Entry Timing | Risk Level | Best For | Win Rate | Risk:Reward |
|---|---|---|---|---|---|
| Breakout | At breakout | Higher (false breakouts) | Scalpers, fast traders | ~55-65% | 1:2 to 1:3 |
| Pullback | After retest | Lower (confirmed support) | Swing traders, patient traders | ~65-75% | 1:3 to 1:5 |
| Multi-TF | After higher TF confirmation | Lowest (trend alignment) | Position traders | ~70-80% | 1:3 to 1:6 |
The Wrong Way vs The Right Way
Most beginners make this mistake: they see a channel and assume it's a flag. They enter too early, get stopped out, and blame the pattern.
The Wrong Way: You spot a downward-sloping channel on EUR/USD and buy immediately because "it's a bull flag." But the flagpole was only 30 pips, and the flag retraced 60% of it. That's not a flag — that's a potential reversal.
The Right Way: You check three things first:
- Is the flagpole strong? At least 50-100 pips on major pairs.
- Is the flag shallow? Retrace no more than 50% of the pole.
- Is the trend clear? Higher timeframe confirms the direction.
Only then do you consider entering.
Common Trap — Why Most Traders Lose on Flag Patterns
Here's something most guides don't tell you: flags work beautifully in trending markets. But in choppy, sideways markets, they fail constantly.
If the market is ranging between 1.0800 and 1.0900 on EUR/USD, a "bull flag" inside that range is just noise. The breakout will likely fail at the range high.
The fix: Only trade flags when the market is clearly trending. Use a moving average (like the 50-period SMA) to confirm. If price is above the 50 SMA on the daily chart, you can look for bull flags. If it's below, look for bear flags.
FAQ — Bull Flag and Bear Flag Patterns
What is the difference between a flag and a pennant?
A flag has parallel trendlines (a rectangle). A pennant has converging trendlines (a triangle). Both are continuation patterns, but flags show a more controlled pause while pennants show increasing indecision.

How reliable are bull flag and bear flag patterns?
In strong trending markets, flag patterns have a 65-80% success rate. The key is confirmation: a strong flagpole, shallow retracement, and volume spike at breakout.
Can I trade flag patterns on any timeframe?
Yes. Flags work on 5-minute charts for scalping and on daily charts for swing trading. But the higher the timeframe, the more reliable the pattern.
What happens if the flag retraces more than 50%?
It's no longer a reliable flag. The trend is weakening. Either skip the trade or wait for a deeper pullback and re-evaluate the setup.
📝 Quick Recap
- Bull flag = uptrend + downward-sloping pause + upside breakout
- Bear flag = downtrend + upward-sloping pause + downside breakout
- Always measure the flagpole for your target
- Use stop losses below (bull) or above (bear) the flag
- Only trade flags in trending markets — not in ranges
- Combine with higher timeframe analysis for better results
⚡ Quick Win — Do This Right Now
Open your chart. Pick EUR/USD on the 1-hour timeframe. Look back at the last 48 hours. Find one sharp move of at least 50 pips. Now look for a small channel that retraced less than half of that move. That's your flag. Mark the breakout level. You just found a potential setup. Practice this on 5 different pairs today.


