
Why Most Traders Get Breakouts Wrong (And Lose Money)
You see price blasting through a resistance level. Your heart races. You click "Buy" without thinking. Then price reverses immediately and stops you out. Sound familiar?
That's a false breakout — or "fake-out" as we call it. And it's the #1 reason most traders lose money on breakouts. They chase price instead of waiting for confirmation.
Here's the truth: a real breakout isn't just price moving through a level. It's price staying through that level with conviction. The difference? About 20-30 pips of patience and a retest.
In this lesson, I'm going to show you the exact breakout trading strategy forex I've used for years. It's simple. It's repeatable. And it caught a 430-pip move on GBPNZD in just 36 hours.
What Is a Breakout? (The Simple Definition)
A breakout happens when price moves outside a defined support or resistance area. That area can be horizontal (a flat level) or diagonal (a trendline).
Think of it like a dam. Support is the wall holding water back. Resistance is the ceiling above. When price breaks through either one, the water (volatility) comes rushing out.
Here's a quick example:
- Bullish breakout: EUR/USD has been stuck at 1.0850 resistance for 3 days. It finally breaks above 1.0855. That's a bullish breakout.
- Bearish breakout: GBP/USD has been holding 1.2650 support for a week. It drops to 1.2645. That's a bearish breakout.
But here's the key — a breakout isn't just the move through the level. It's what happens after that determines if it's real.
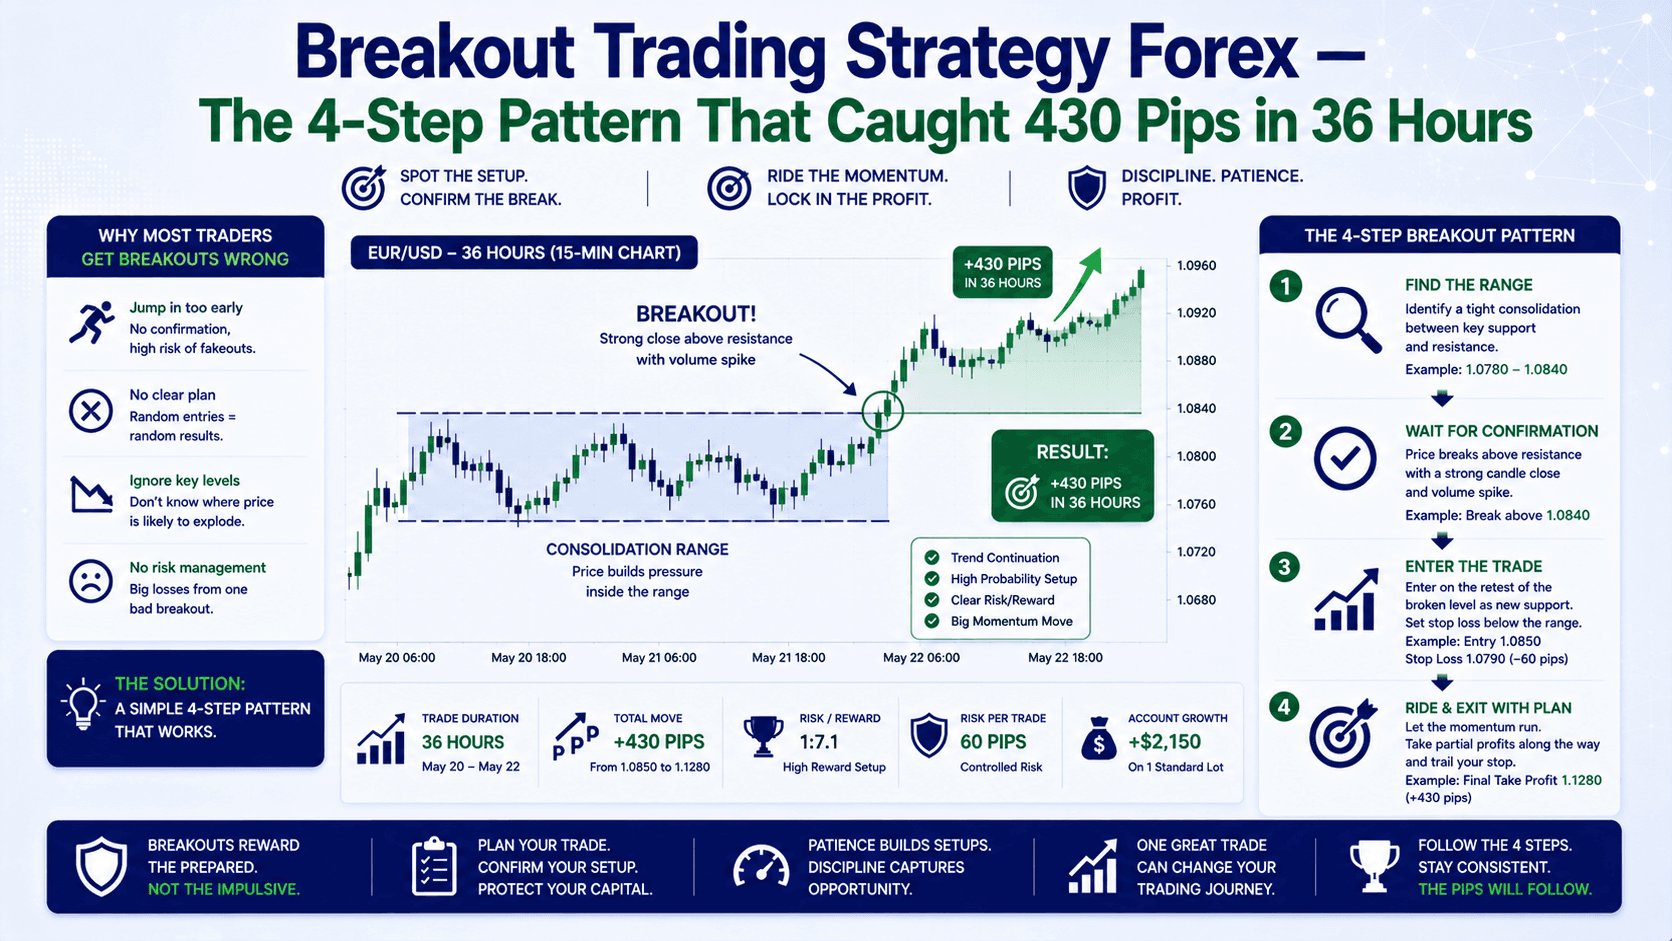
The 4-Step Breakout Trading Strategy Forex Pattern
This is the pattern I've used for years. It's responsible for some of my biggest wins. The setup has 4 parts:

- Support — A rising trendline that price bounces off
- Resistance — A falling trendline that price rejects
- Breakout — Price finally breaks through one of these lines
- Retest — Price comes back to test the broken level (now flipped)
This forms a wedge pattern — price getting squeezed tighter and tighter between two converging lines. The longer the squeeze, the bigger the explosion.
Real Example: USD/JPY 4-Hour Wedge Breakout
Let me walk you through a real trade. USD/JPY on the 4-hour chart formed a clear wedge pattern:
- Support trendline: rising from 148.50 to 149.20
- Resistance trendline: falling from 150.00 to 149.60
- Breakout: Price broke below the support trendline at 149.10
- Retest: Price came back up to 149.15 (old support → new resistance)
Entry: Short at 149.15 (after the retest)
Stop Loss: 13 pips above entry at 149.28 (above the breakout candle)
Target: 148.65 (a strong support level from the daily chart)
That's a 50-pip target with a 13-pip stop. Risk:reward = 3.8:1. If you risked 2% of your account, you'd make 7.6% in 32 hours.
Pretty cool, right?
The Retest — Your Best Friend (Or Your Worst Enemy)
The retest is the most important part of this breakout trading strategy forex. Here's why:
When price breaks through support, that old support level becomes new resistance. When it breaks through resistance, that old resistance becomes new support. This is called a role reversal.
Most beginners enter at the breakout candle itself. That's risky because:
- You don't know if it's a fake-out
- Your stop loss has to be very wide
- You're at the mercy of the first candle's momentum
Instead, wait for the retest. Price comes back to the broken level, touches it, and bounces off. That's your confirmation. Enter there.
When There's No Retest (And What To Do)
Here's the problem — sometimes the market is too strong to give you a retest. Like this GBPNZD trade from a few years back:
- Wedge formed on the 4-hour chart
- Price broke support at 1.7550
- No retest — price just kept dropping
What do you do? Watch for sideways consolidation. If price moves sideways for 3-4 candles after the breakout, it's a sign the retest isn't coming. Enter with a market order at that point.
For that GBPNZD trade:
- Entry: 1.7550 (market order after 4 sideways candles)
- Stop Loss: 45 pips above at 1.7595
- Target: 1.7375 (a recent low from weeks earlier)
That's a 175-pip target with a 45-pip stop. Risk:reward = 3.9:1. The trade lasted 36 hours and made 7.8% on 2% risk.
Where to Set Your Stop Loss and Target
Stop Loss Placement
Your stop loss should be above or below the breakout candle. Not the retest candle. The breakout candle. Here's why:
The breakout candle is the one that first broke the support or resistance level. If price comes back and takes out that candle's high/low, the breakout is likely false. Your stop should be just beyond that candle's extreme.
Example for a short trade:
- Breakout candle low: 149.10
- Breakout candle high: 149.30
- Your stop: 149.30 (1-2 pips above)
Target Placement
Use price action levels — not arbitrary pip targets. Look at the higher timeframe (daily or 4-hour) for:
- Recent swing highs/lows
- Strong support/resistance zones
- Previous consolidation areas
For the USD/JPY trade, the target was a support level that had held for months on the daily chart. Simple and logical.
Breakout Trading vs. False Breakout — Comparison Table
| Characteristic | Real Breakout | False Breakout (Fake-Out) |
|---|---|---|
| Volume at breakout | High — strong conviction | Low — weak momentum |
| Retest behavior | Price bounces off the broken level | Price breaks back through immediately |
| Consolidation after breakout | Price moves away quickly or consolidates sideways | Price stalls and reverses within 2-3 candles |
| Stop loss placement | Above/below breakout candle — manageable | Same, but gets hit within hours |
| Trader action | Wait for retest or sideways consolidation | Enter immediately — gets trapped |
FAQ
What is the best time frame for breakout trading?
The 4-hour and daily time frames work best. They give you enough context to identify strong support/resistance levels without the noise of lower time frames.

How do I avoid false breakouts?
Wait for a retest or at least 3-4 candles of sideways consolidation after the breakout. Never enter on the breakout candle itself. Use a stop loss above/below the breakout candle.
Can I use indicators with breakout trading?
Yes. The RSI can help confirm momentum. If RSI is above 50 during a bullish breakout, it adds conviction. But price action alone is enough — keep it simple.
What's the minimum risk:reward I should aim for?
At least 1:2. But with this strategy, you'll often get 1:3 or higher because the stop loss is tight (above/below the breakout candle) and targets are based on significant price levels.
Quick Recap
- A breakout is price moving outside a defined support or resistance area
- The 4-step pattern: support → resistance → breakout → retest
- Always wait for a retest or sideways consolidation before entering
- Place your stop loss above/below the breakout candle (not the retest candle)
- Use price action levels on higher timeframes for targets
- The longer the consolidation, the more volatile the breakout
Your Quick Win
Open your charts right now. Pull up EUR/USD on the 4-hour timeframe. Find the last 3 instances where price consolidated between two converging trendlines (a wedge). Did price break out? Was there a retest? Mark the breakout candle and the retest candle. Do this for 5 pairs. You'll start seeing the pattern everywhere.


