
Ever Entered a Trade That Looked Perfect — Only to Watch Price Go Nowhere?
You see a breakout. EUR/USD blasts through resistance at 1.0920. You jump in long at 1.0925 with a 0.1 lot. Fifteen minutes later, price is back at 1.0910. Your stop gets hit. You lose $15.
What happened? You entered a false breakout — a move that looked like a trend but had no strength behind it.
This is exactly where the ADX indicator how to use becomes your edge. The Average Directional Index (ADX) doesn't tell you which way price is going. It tells you how hard it's moving. And that single piece of information saves you from fakeouts and keeps you in real trends.
Let's break down exactly how to use it — with real numbers, real charts, and the mistakes most traders make.
What the ADX Actually Measures (And Why It's Different From Every Other Indicator)
Most indicators try to predict direction. RSI tells you if price is overbought. MACD shows momentum direction. Stochastic gives you reversal signals.
The ADX does none of that.
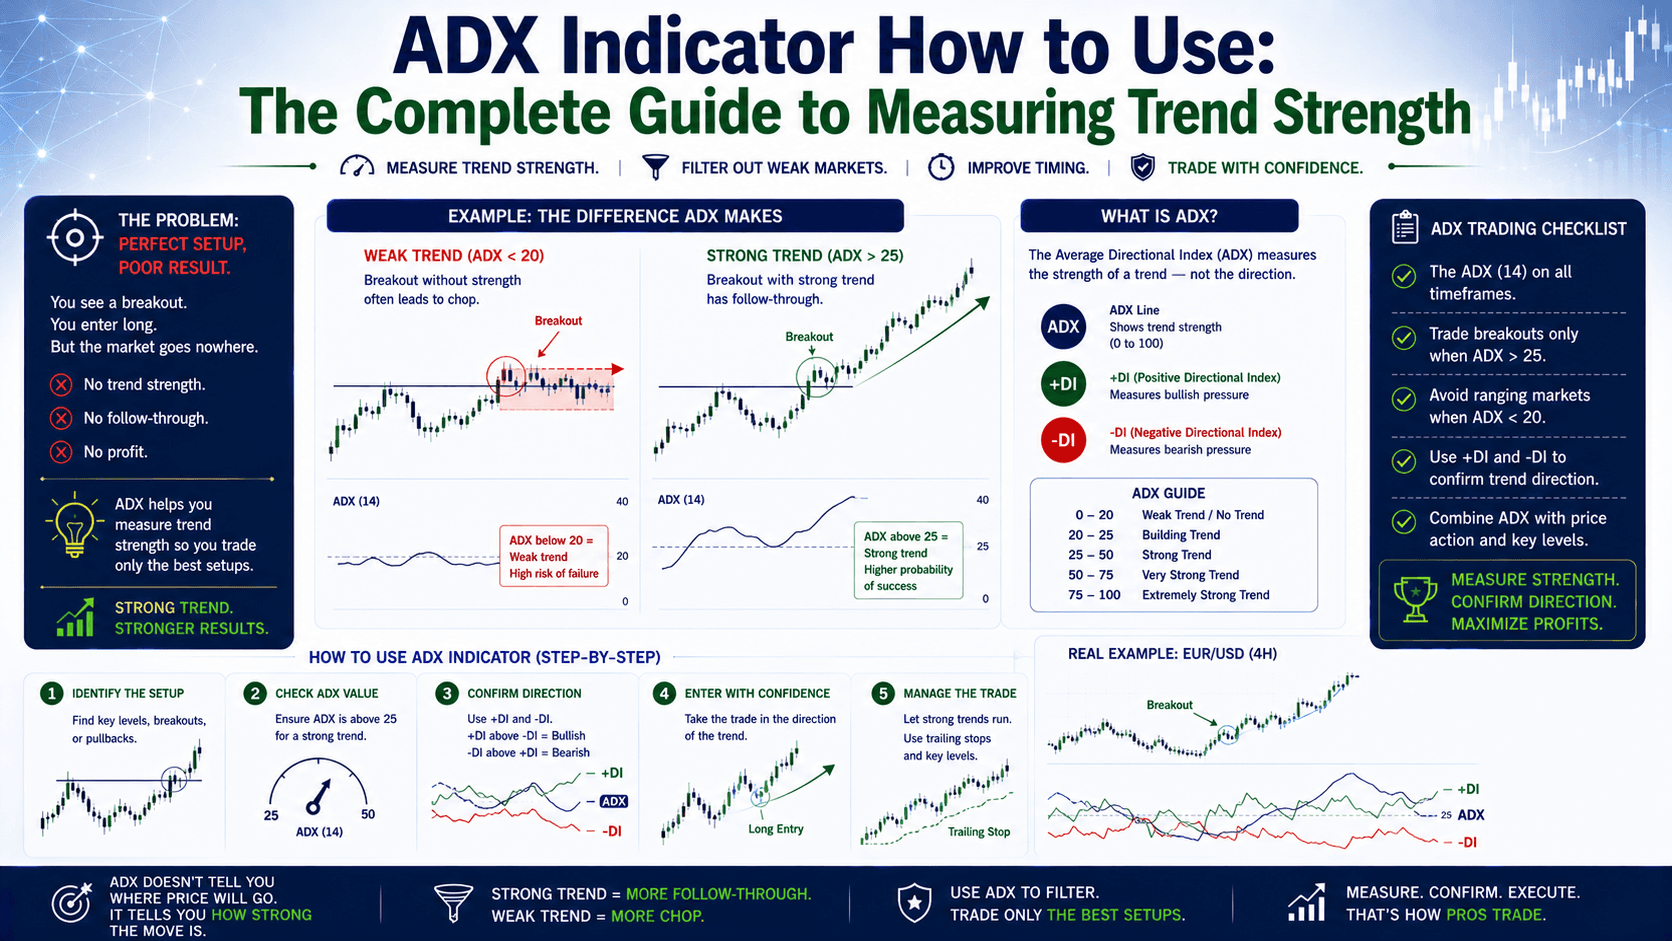
ADX measures trend strength only. It's a non-directional oscillator that ranges from 0 to 100. A reading above 25 means a strong trend exists. Below 20 means the market is ranging or consolidating.
Here's the key insight most beginners miss: ADX can be rising during both uptrends AND downtrends. It doesn't care about direction. It only cares about conviction.
| ADX Reading | Trend Strength | What It Means For You |
|---|---|---|
| 0-20 | Weak / Ranging | Don't use trend-following strategies. Trade ranges or wait. |
| 20-25 | Possible trend forming | Watch for confirmation. Don't enter yet. |
| 25-50 | Strong trend | Trend-following strategies work well. Enter on pullbacks. |
| 50-75 | Very strong trend | Trend is mature. Consider tightening stops. |
| 75-100 | Extremely strong / Overextended | Reversal risk is high. Look for exhaustion signals. |
The 3-Line Setup: ADX + DI Lines Give You Direction
The ADX indicator usually comes with two additional lines: +DI (positive directional indicator) and -DI (negative directional indicator). These tell you direction.

Here's how the three lines work together:
- +DI above -DI = Uptrend in progress
- -DI above +DI = Downtrend in progress
- ADX above 25 = That trend has strength
- ADX below 20 = No strong trend, even if DI lines have crossed
Think of it this way: +DI and -DI tell you who's winning the fight. ADX tells you how hard they're punching.
Let's look at a real example on GBP/USD:
The Wrong Way (Most Beginners Do This):
You see +DI cross above -DI on the 1-hour chart. GBP/USD is at 1.2650. You go long with 0.1 lots, stop at 1.2620 (30 pips). But ADX is at 18 — below 20. The crossover had no strength behind it. Price drifts sideways for 2 hours, then drops to 1.2615. You're stopped out for a $30 loss.
The Right Way:
You wait for +DI to cross above -DI and ADX to be above 25. GBP/USD is at 1.2670. ADX reads 28 and rising. +DI is clearly above -DI. You enter long at 1.2672 with 0.1 lots, stop at 1.2642 (30 pips). Target: 1.2732 (60 pips).
Price moves to 1.2735 in 4 hours. You make $63. The ADX confirmed the trend had legs.
How to Use ADX to Avoid False Breakouts (The #1 Beginner Killer)
False breakouts are the most expensive mistake in forex. You see price break a key level, you enter, and then price reverses immediately.
ADX is your filter.
The Rule: Only trade breakouts when ADX is above 25 and rising. If ADX is below 20 when price breaks a level, there's a high probability it's a fakeout.
Here's a concrete scenario on EUR/USD:
Price has been ranging between 1.0850 and 1.0900 for 3 days. ADX is at 15. Suddenly, price breaks above 1.0900 to 1.0910.
Scenario A (No ADX check): You buy at 1.0912 with 0.1 lots. Stop at 1.0882 (30 pips). Price immediately drops back to 1.0895. You lose $27.
Scenario B (With ADX check): You see the breakout but ADX is at 16. You wait. Price drops back to 1.0890. You saved $27 by doing nothing.
Now imagine the same range, but ADX has risen to 32 when price breaks 1.0900. You enter at 1.0905 with 0.1 lots. Stop at 1.0875 (30 pips). Target: 1.0965 (60 pips). Price reaches 1.0970. You make $65.
The difference? ADX confirmed the breakout had momentum.
ADX Divergence: When Price and Strength Disagree
One of the most powerful uses of ADX is spotting divergence — when price makes a higher high but ADX makes a lower high. This signals that trend momentum is weakening, even though price is still moving.
Example on Gold (XAU/USD):
Gold rallies from $2,350 to $2,380 over 5 days. ADX peaks at 48 during the initial rally. Then price makes a new high at $2,385, but ADX only reaches 38. That's a lower high.
This is a warning. The trend is losing steam. You don't close immediately — but you tighten your stop. If you're long from $2,355 with a 0.1 lot, you might move your stop from $2,330 to $2,365 to protect profit.
Two days later, Gold drops to $2,340. You're out at $2,365 with a $100 gain instead of watching it all disappear.
ADX in Ranging Markets: When NOT to Trade
This is the most underrated skill: knowing when to stay out.
When ADX stays below 20 for an extended period, the market is ranging. Trend-following strategies will get chopped up. Every breakout will fail. Every crossover will reverse.
What to do instead:
- Trade the range: buy at support, sell at resistance
- Use mean-reversion strategies (RSI, Stochastic)
- Wait for ADX to break above 25 before switching back to trend strategies
| Market Condition | ADX Reading | Best Strategy | Worst Strategy |
|---|---|---|---|
| Strong Trend | Above 25 | Trend following, pullback entries | Counter-trend, range trading |
| Weak Trend / Ranging | Below 20 | Range trading, mean reversion | Trend following, breakout entries |
| Transitioning | 20-25 | Wait for confirmation | Any entry without confirmation |
FAQ
Is ADX a leading or lagging indicator?
ADX is a lagging indicator. It confirms trends that are already in motion, not predicts them. That's why it works best as a filter, not a standalone signal.

What is the best ADX setting for forex?
The default 14-period setting works well for most traders. Day traders sometimes use 7-10 for faster signals. Swing traders use 20-30 for smoother readings. Test each on a demo first.
Can ADX be used alone?
Technically yes, but it's not recommended. ADX tells you trend strength but not direction. Always pair it with +DI/-DI lines, price action, or another directional indicator like moving averages.
What does ADX below 20 mean?
It means the market is ranging or consolidating. There's no strong trend. Trend-following strategies will likely fail. Either trade the range or wait for ADX to rise above 25.
Quick Recap
- ADX measures trend strength, not direction. Above 25 = strong trend. Below 20 = ranging.
- Pair ADX with +DI and -DI lines to get both strength and direction.
- Use ADX above 25 to confirm breakouts and avoid false signals.
- Watch for ADX divergence — lower highs while price makes higher highs = weakening trend.
- When ADX is below 20, switch to range-trading strategies or stay out.
Quick Win: Do This Right Now
Open your EUR/USD chart on the 1-hour timeframe. Add the ADX indicator (default 14 period). Scroll back through the last 2 weeks.
Find 3 examples where ADX was below 20. Notice how price was moving sideways. Then find 3 examples where ADX broke above 25. Notice the strong directional moves that followed.
That pattern — ranging to trending — is the single most valuable signal ADX gives you. Start watching for it.


